
A Batch Transform, Node by Node
Tento obsah zatím není dostupný ve vašem jazyce.
Module 2 in the chapter Data Transforms, chapter 7 of the Data 360 Architect course. Each module stands on its own. Previous: When the Shape Is Wrong · Next: Layers That Build on Each Other
The question this module answers: How do you build a batch transform, and what does each node do?
Let’s build one. We’ll take real flight data, transform it, and put it into a new data lake object, without writing code.
The data and the question
Section titled “The data and the question”The data is real: every flight into or out of Phoenix Sky Harbor (PHX) in August 2026, from the US Bureau of Transportation Statistics (BTS). That’s 29,524 flights by 10 airlines: 14,757 leaving PHX and 14,767 arriving. US airlines report each flight’s times, delays and cancellations to BTS, and BTS publishes them. You’ll find a dated copy on SkyData (opens in a new tab), with its source and its columns described.
Each row is one flight, in BTS’s own 109 columns. The ones we need: FlightDate, the airline’s code (Reporting_Airline), the flight number, Origin and Dest, the scheduled and actual times, the delays, and two flags, Cancelled and Diverted. SkyData’s data card (opens in a new tab) describes every column, and the surprises in it are worth reading before you build anything: midnight is written 2400, there’s no time zone, and the flags are written as decimals, 1.00 and 0.00.
Bring it in the way chapters 4 and 6 showed: a stream, and a raw lake object for the flights. In my org I called it Flight_PHX_SkyData, category Other: in this course flights are always other data (chapter 6, module 3, “Flights: our rule”). Two type decisions matter here. The flight number came in as a number, and I changed it to text: it’s an identifier, and you never add flight numbers up. And the primary key is a formula field, Flight_Key, that joins the date, the airline, the flight number and the origin airport, for example 2026-08-14_AA_336_DFW, American 336 from Dallas/Fort Worth on August 14 (chapter 3, module 3).
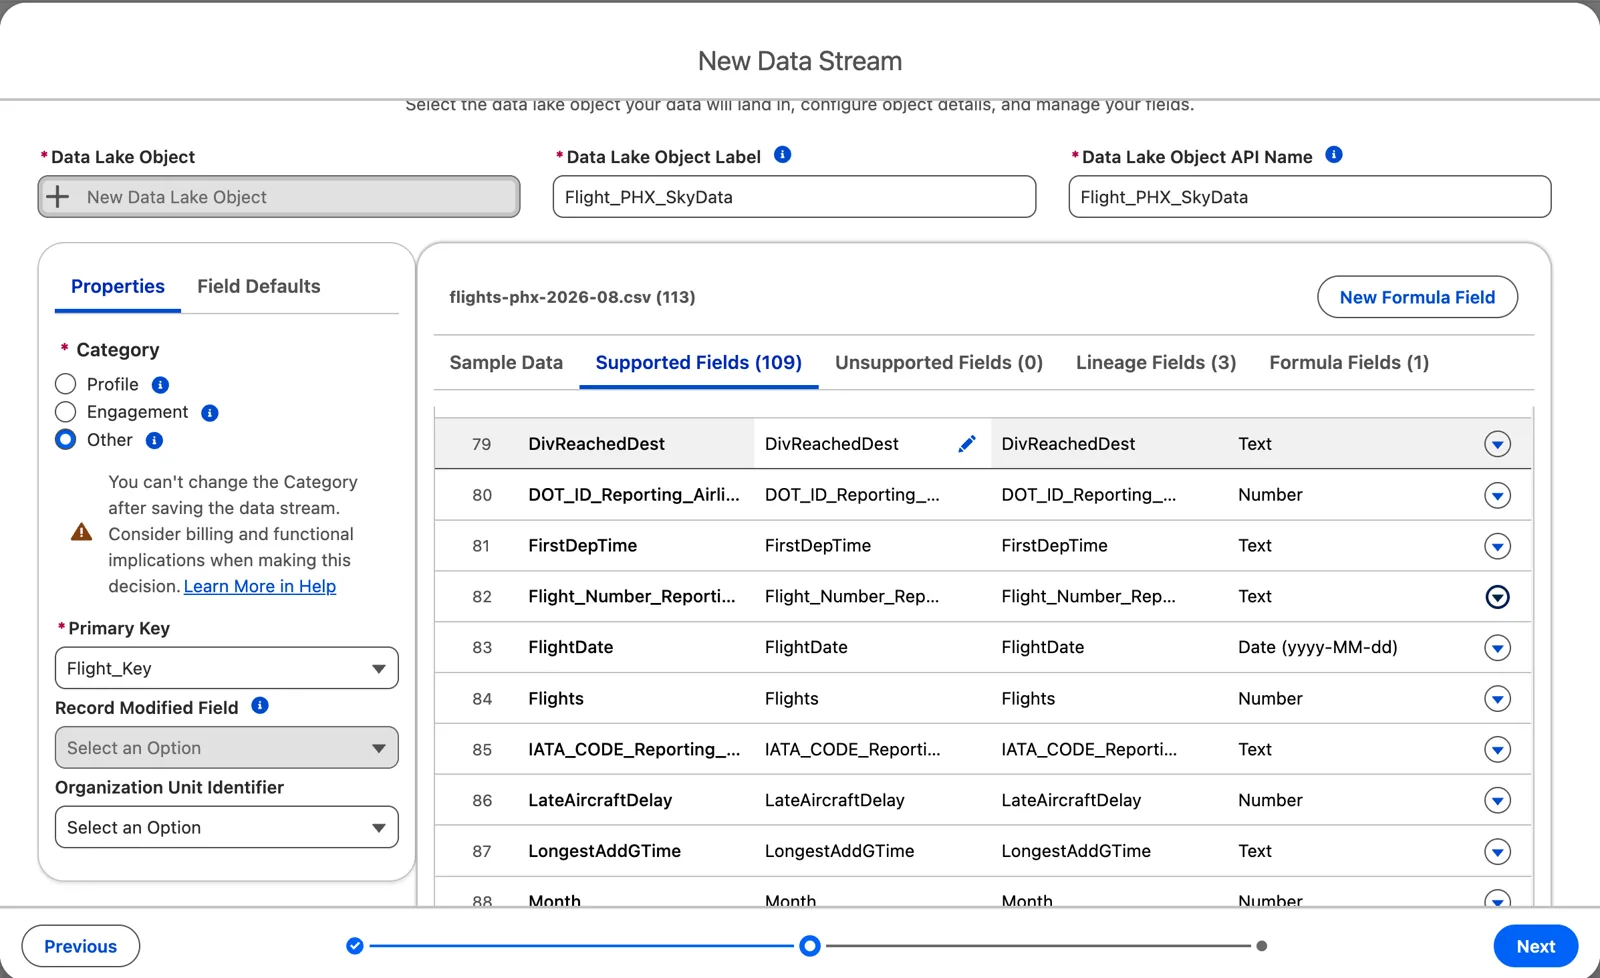
The flights stream: the flight number set to text, the primary key a formula field (Salesforce Data 360 in a Developer Edition org, screenshot, November 2026). Full size
The examples below are from my own run of this transform, in a Developer Edition org, in November 2026. Screens change; the steps are what to follow.
Now let’s assume the business wants it broken down by day, by airline. How many flights did each airline land at PHX on each day? No row says that. So we’ll build a batch transform that reads the flights and writes a new object with the answer.
This is a summary: it reads one object and writes a smaller one about it. Module 3 shows the layers that a project builds underneath a summary like this.
In the builder, you string nodes together from left to right. Here’s the whole plan before we start:
- Input: the flights, with only the columns we need.
- Filter: flights that really arrived at PHX.
- Transform: drop a column we don’t need, and write the date as text for the key.
- Aggregate: count the rows by airline and by day.
- Transform: build the keys.
- Output: write the result to a new data lake object.
1. Input: choose your columns
Section titled “1. Input: choose your columns”On the Data Transforms tab, create a new transform and choose Batch Data Transform. Then choose where the data comes from: data lake objects or data model objects. We’ll use the lake objects, because the model comes in chapter 8. (A transform that runs on data model objects is restricted to a data space, so there you’d pick the data space too.)
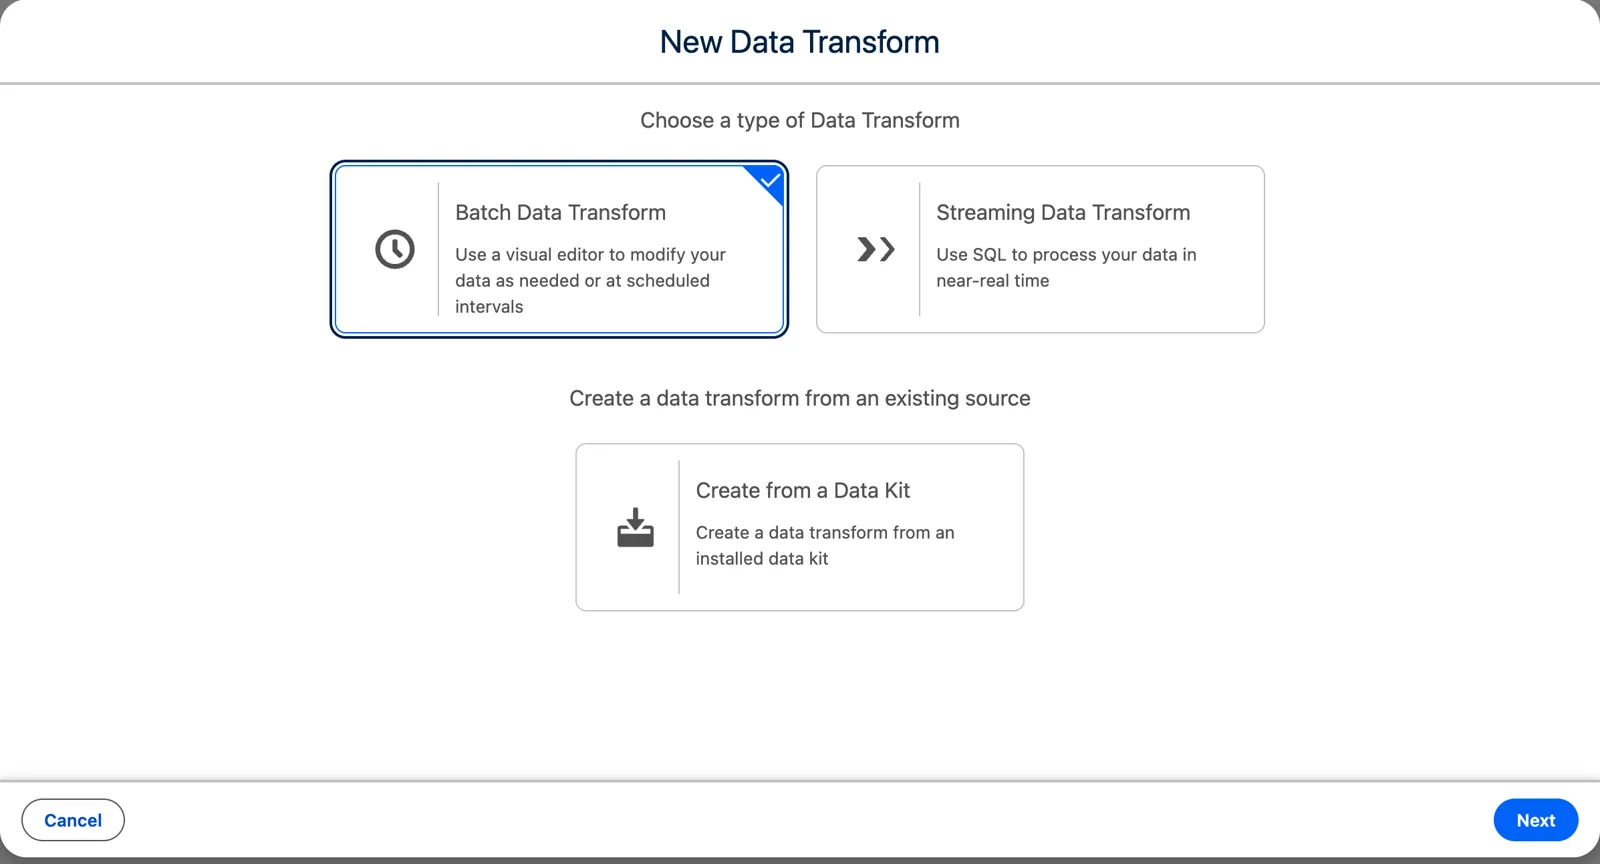
Choosing a batch data transform (Salesforce Data 360 in a Developer Edition org, screenshot, November 2026). Full size
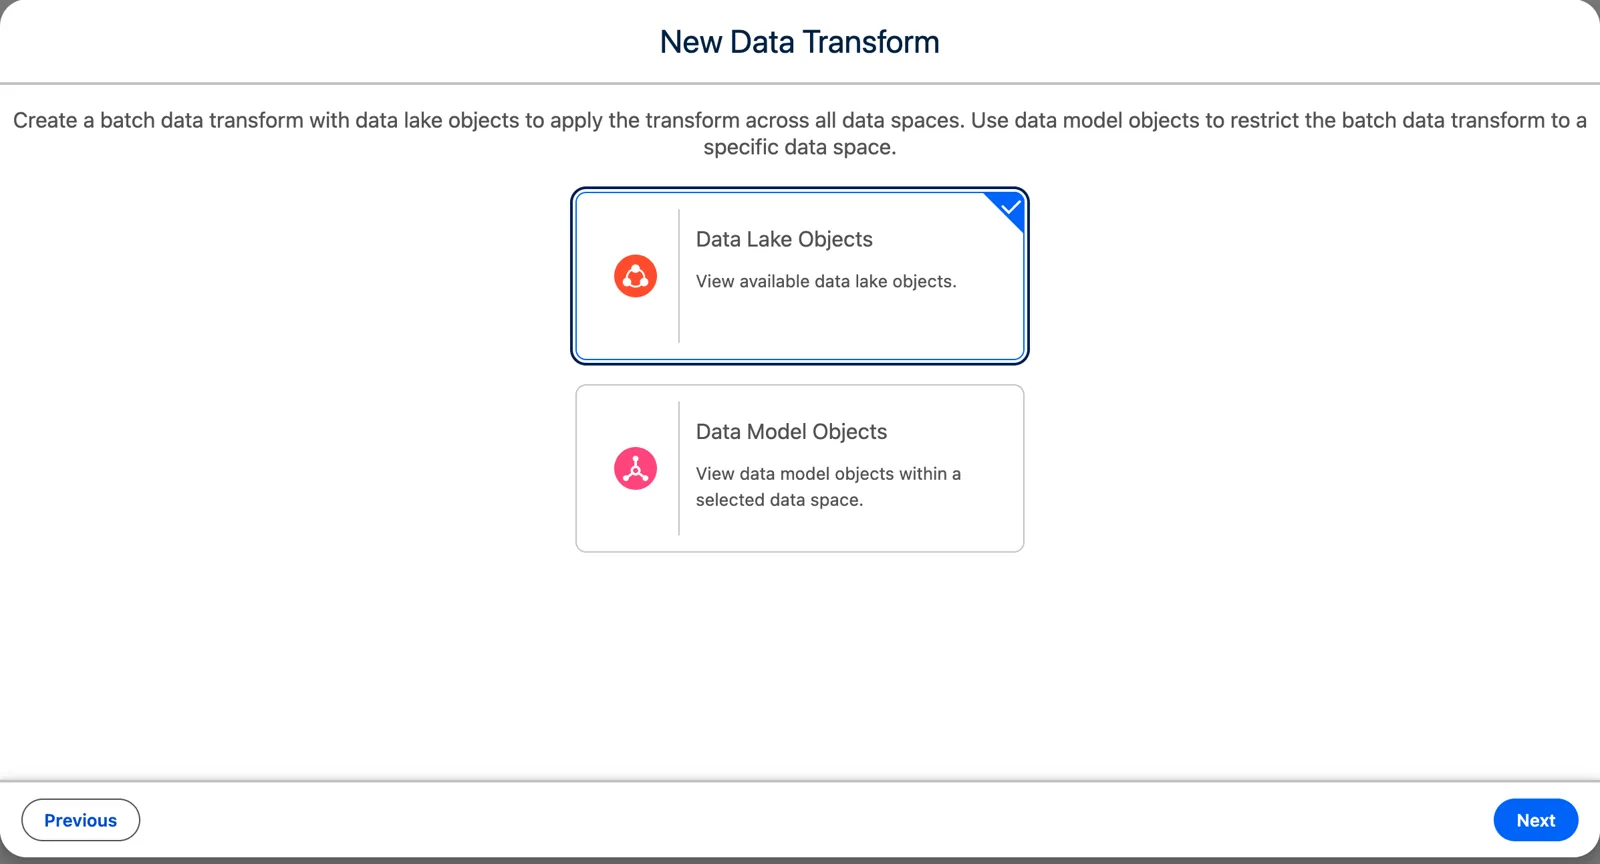
Lake objects or model objects (Salesforce Data 360 in a Developer Edition org, screenshot, November 2026). Full size
The builder opens empty, with one button: Add Input Data. Tick the flights object, and you get to choose, right at this moment, which fields to include. Look at the count first. In my org it said “50 of 115 columns selected”: the builder had already picked 50 for me. There are 115 because Data 360 adds its own columns to BTS’s, such as a key qualifier column, KQ_Flight_Key. Don’t take the default. Clear them all with the checkbox at the top of the list, then tick only what you need.
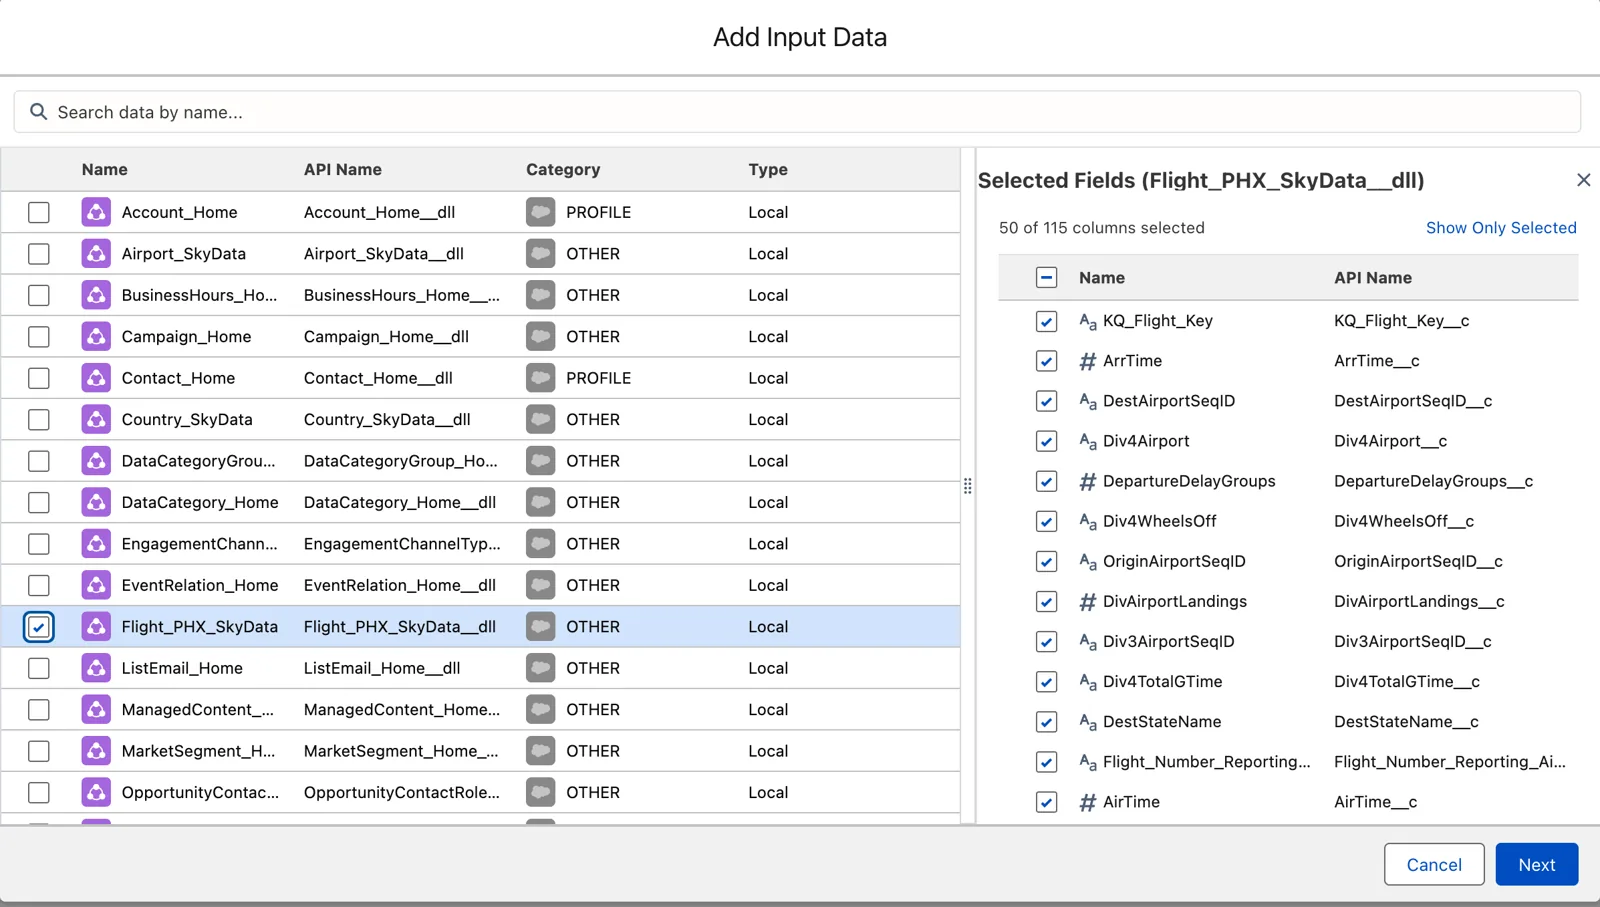
The builder picks 50 of 115 columns for you (Salesforce Data 360 in a Developer Edition org, screenshot, November 2026). Full size
We want the airline, so the airline’s code (Reporting_Airline). We need the day, so FlightDate. We need to know where each flight went and whether it got there, so Dest, Cancelled and Diverted. Let’s assume we accidentally included one more field, the tail number (Tail_Number). I’ll show you how to adjust for it. That’s 6 of 115. You don’t need the primary key here; the builder didn’t ask for it.
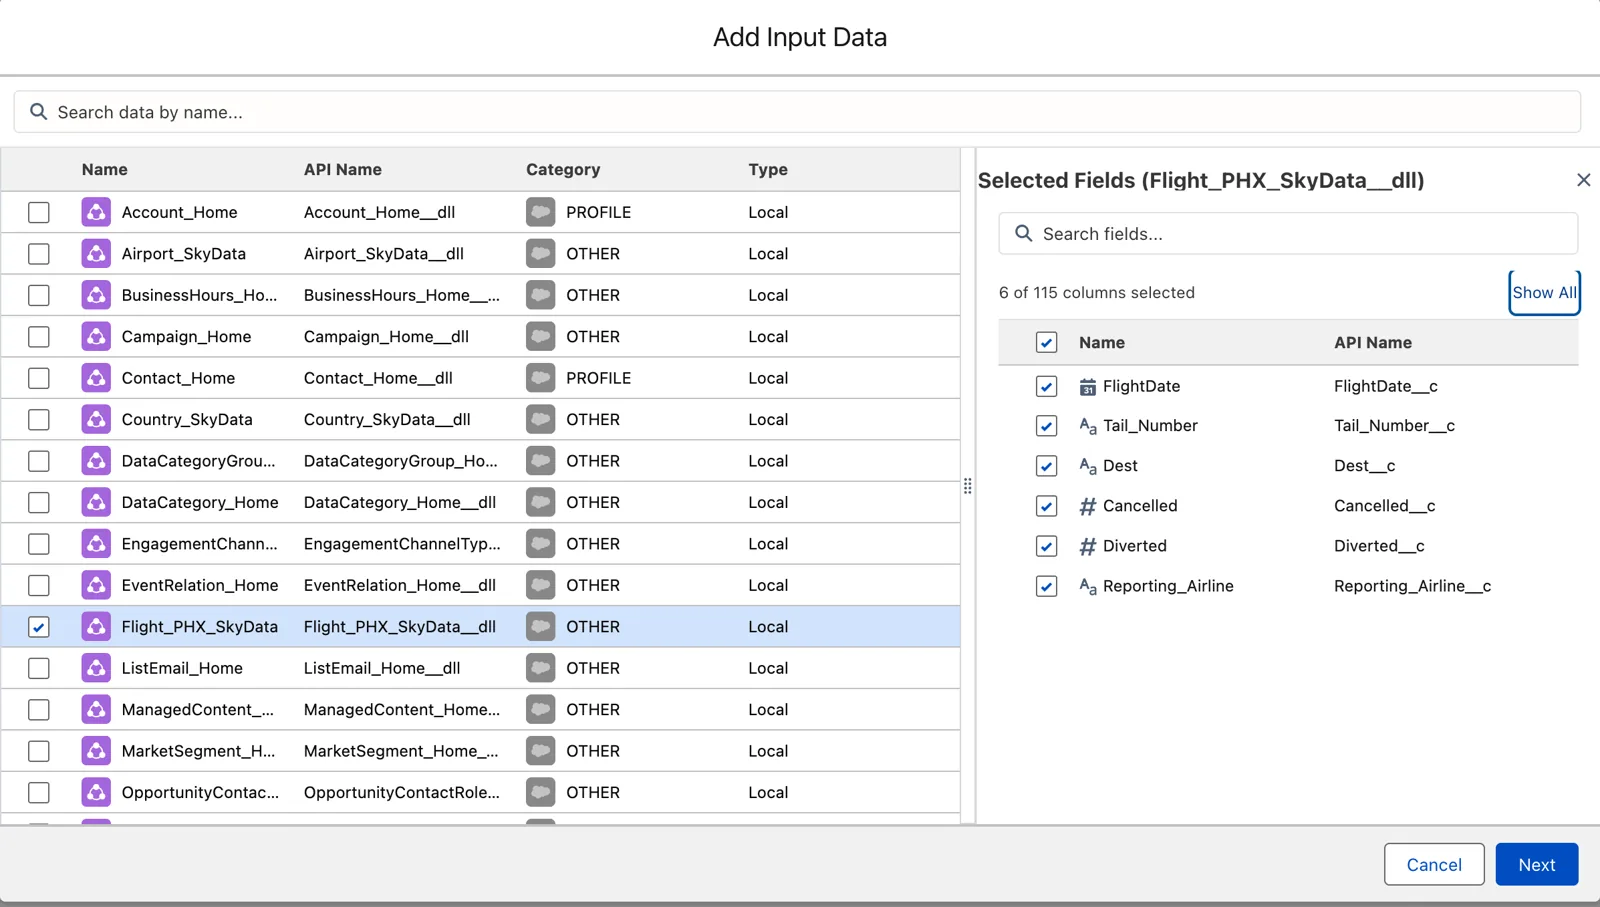
Only the six columns we need (Salesforce Data 360 in a Developer Edition org, screenshot, November 2026). Full size
Click Next, and this becomes the first node in the transform: the input node, which represents the source object.
2. Filter: the flights that arrived
Section titled “2. Filter: the flights that arrived”Add a node after the input and choose Filter. If you just pause a moment, it gives you a nice little preview of your data, and I find this extremely helpful: seeing my data.
What does “arrived at PHX” mean in this data? Look at the rows before you decide. The destination says where a flight was going, not where it ended up. A cancelled flight never flew. A diverted flight landed somewhere else. So “arrived at PHX” is three conditions together:
- the destination is
PHX, - cancelled is
0, - diverted is
0.
In August 2026, 14,767 flights were headed to PHX. 91 were cancelled and 115 diverted, so 14,561 really arrived.
One more thing to look at: how the flags are written. BTS writes them as 1.00 and 0.00. If the stream brought them in as numbers (chapter 6), the filter “equals 0” works; in my org they came in as numbers without my changing anything, and the filter gave me a number box to type 0 in. If they came in as text, the value to match is 0.00, and 0 matches nothing. Same data, a different answer, depending on a type decided long before this transform.
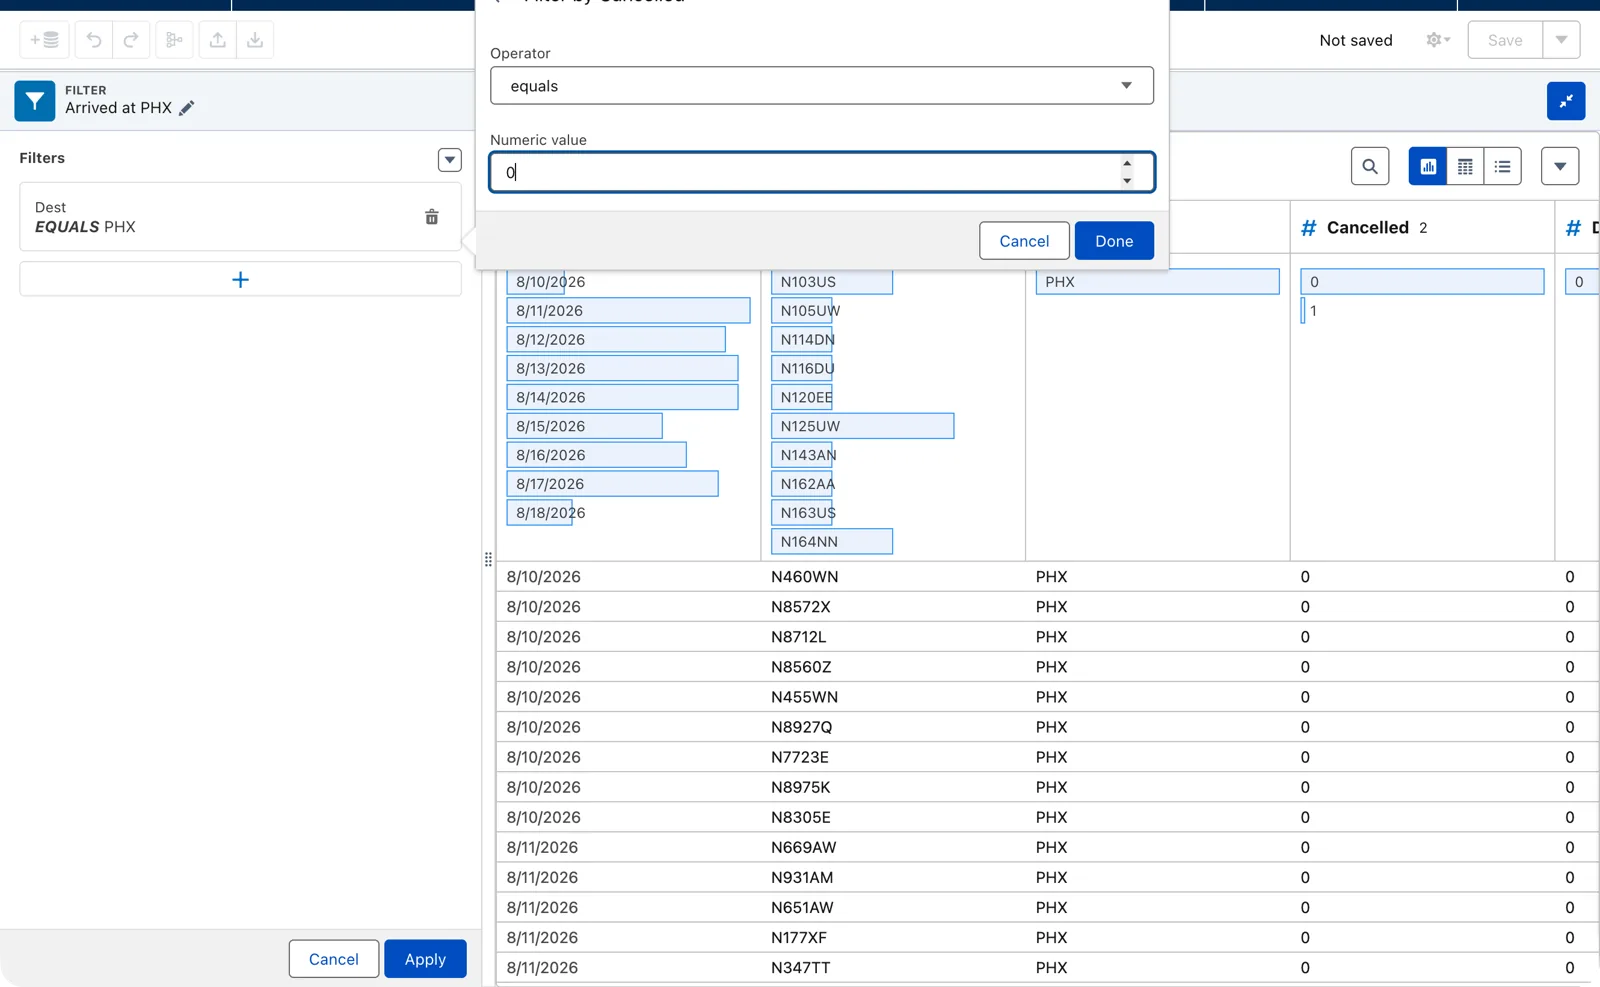
The cancelled flag as a number (Salesforce Data 360 in a Developer Edition org, screenshot, November 2026). Full size
That’s the kind of question the data answers for you if you look, and a rule that skips it counts flights that never landed.
For the destination, the filter looks at the data and gives you the equivalent of a picklist choice: choose PHX, and you’re done. Two things from Salesforce’s page to keep in mind here:
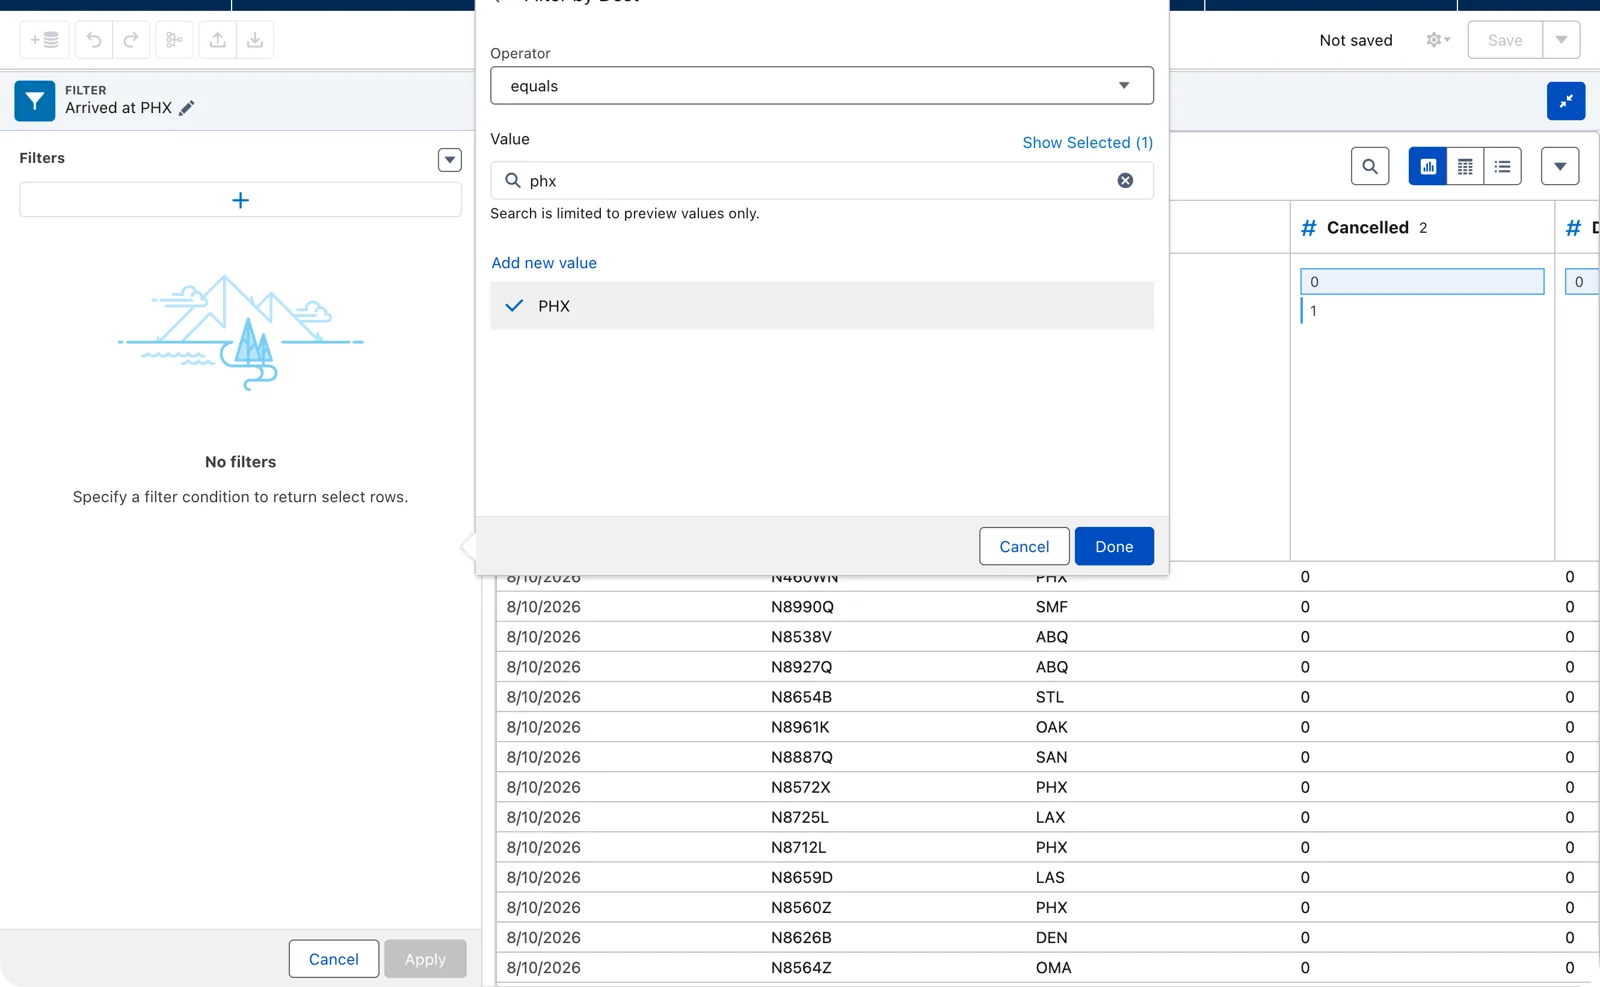
A filter value chosen from the preview (Salesforce Data 360 in a Developer Edition org, screenshot, November 2026). Full size
- That list “displays only the values present in the preview dataset.” A value that exists in your data but not in the preview sample won’t be in the list. You can still type it in.
- “Filter values are case-sensitive.”
PHXandphxare different values.
Add the three conditions one at a time with +. The filter shows them as “Include Rows Matching 1 AND 2 AND 3”: all three must be true. If you need OR, the filter menu offers your own filter logic.
Then name the node. Give it a good descriptive name, like “Arrived at PHX”. In a transform with ten nodes, the names are how the next person reads it. That filter just cut the data points roughly in half: in my preview, 500 rows became 256.
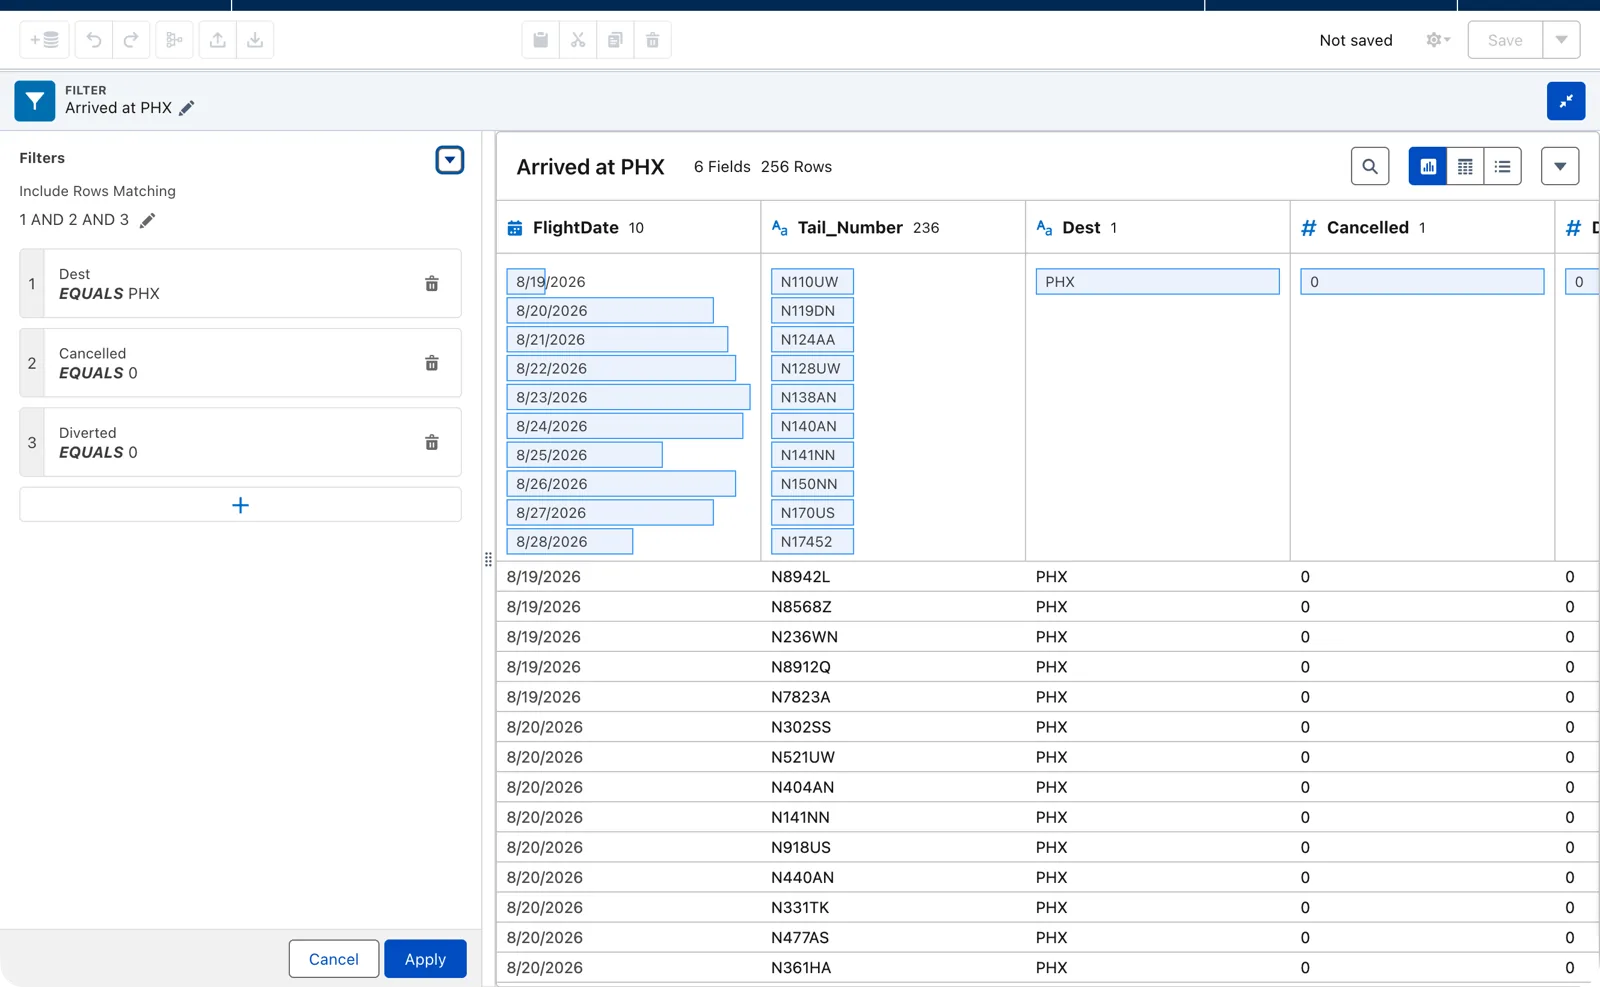
Three conditions together (Salesforce Data 360 in a Developer Edition org, screenshot, November 2026). Full size
3. Transform: drop a column, add a date for the key
Section titled “3. Transform: drop a column, add a date for the key”Add the next node and choose Transform. A transform node holds a series of steps, and it lists your columns. One step is to drop a column, so drop the tail number. Here’s the way that works: tick the box beside Tail_Number, and a toolbar of transformations appears above the list. Click Drop Columns (hover over the icons to find it). The panel asks Drop or Keep, with your column selected; choose Drop and apply. I tried Remove in the column’s own menu first, and nothing happened. You know it worked when a step, “Drop Columns”, appears on the left. Salesforce: “From this point forward, dropped columns can’t be used in transformations and nodes.”
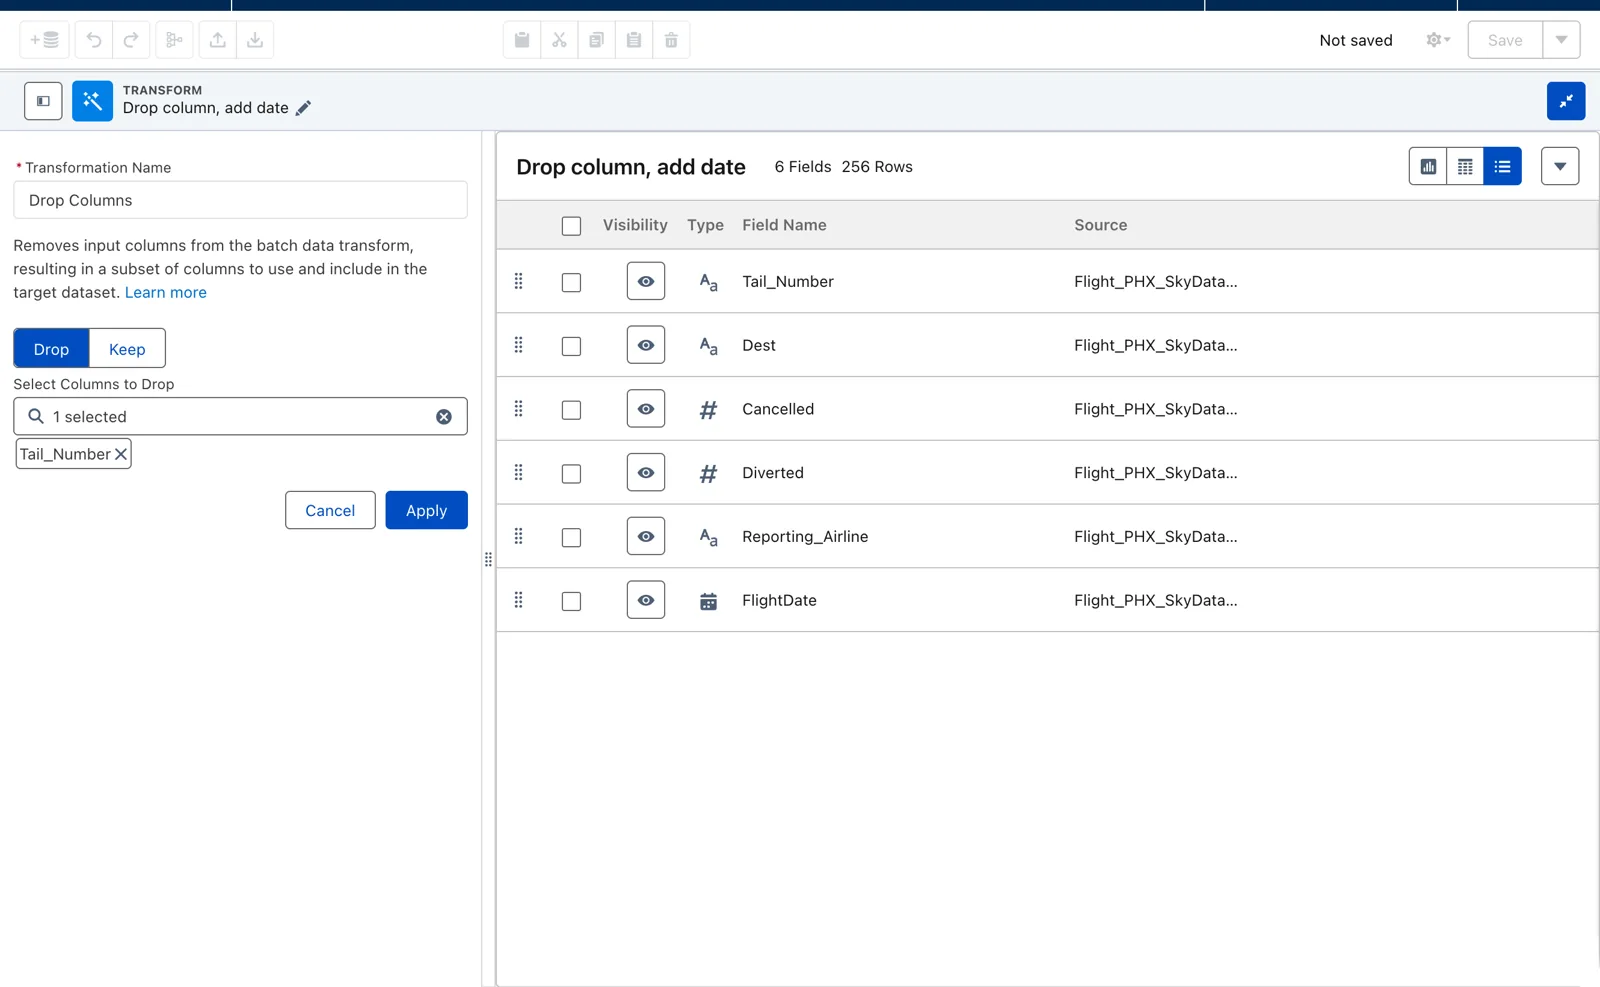
Dropping a column (Salesforce Data 360 in a Developer Edition org, screenshot, November 2026). Full size
The flight date is already a date, so we can count by it as it is. But in a moment we’ll build a key from it, and a key is text with one fixed format. So, in the same transform node, tick FlightDate and add a calculated field with a formula that writes the date as text, year, month, day:
date_format(FlightDate__c, 'yyyy-MM-dd')Set the output type to Text, keep the original column, and call the new column Arrival_Date. Give the step a name too, like “Write the date as text”.
Notice FlightDate__c. The first time, I typed FlightDate, the name on the screen, and the editor said: “Your formula uses a field that doesn’t exist. Update or remove the fields FlightDate.” The formula wants the column’s API name, not its label. The editor’s Columns tab lists both; click a column there and it goes into the formula for you.
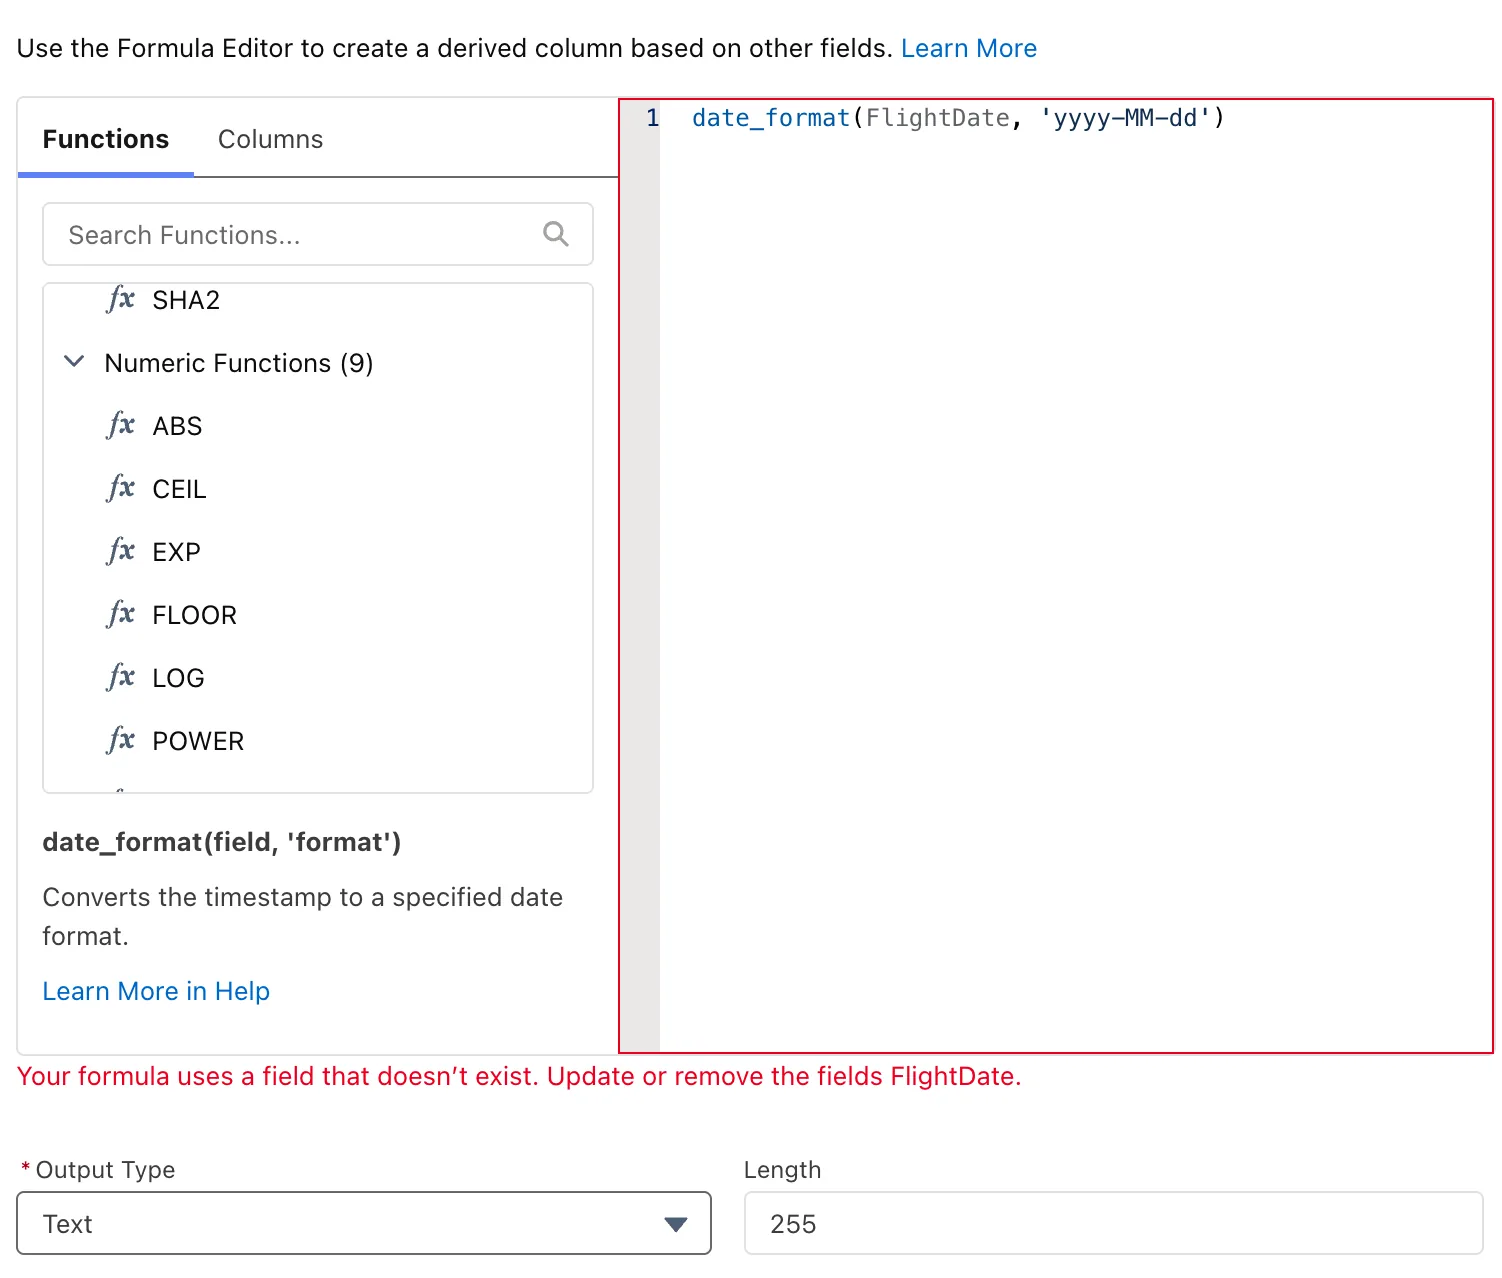
A label in a formula, and the error it gives (Salesforce Data 360 in a Developer Edition org, screenshot, November 2026). Full size
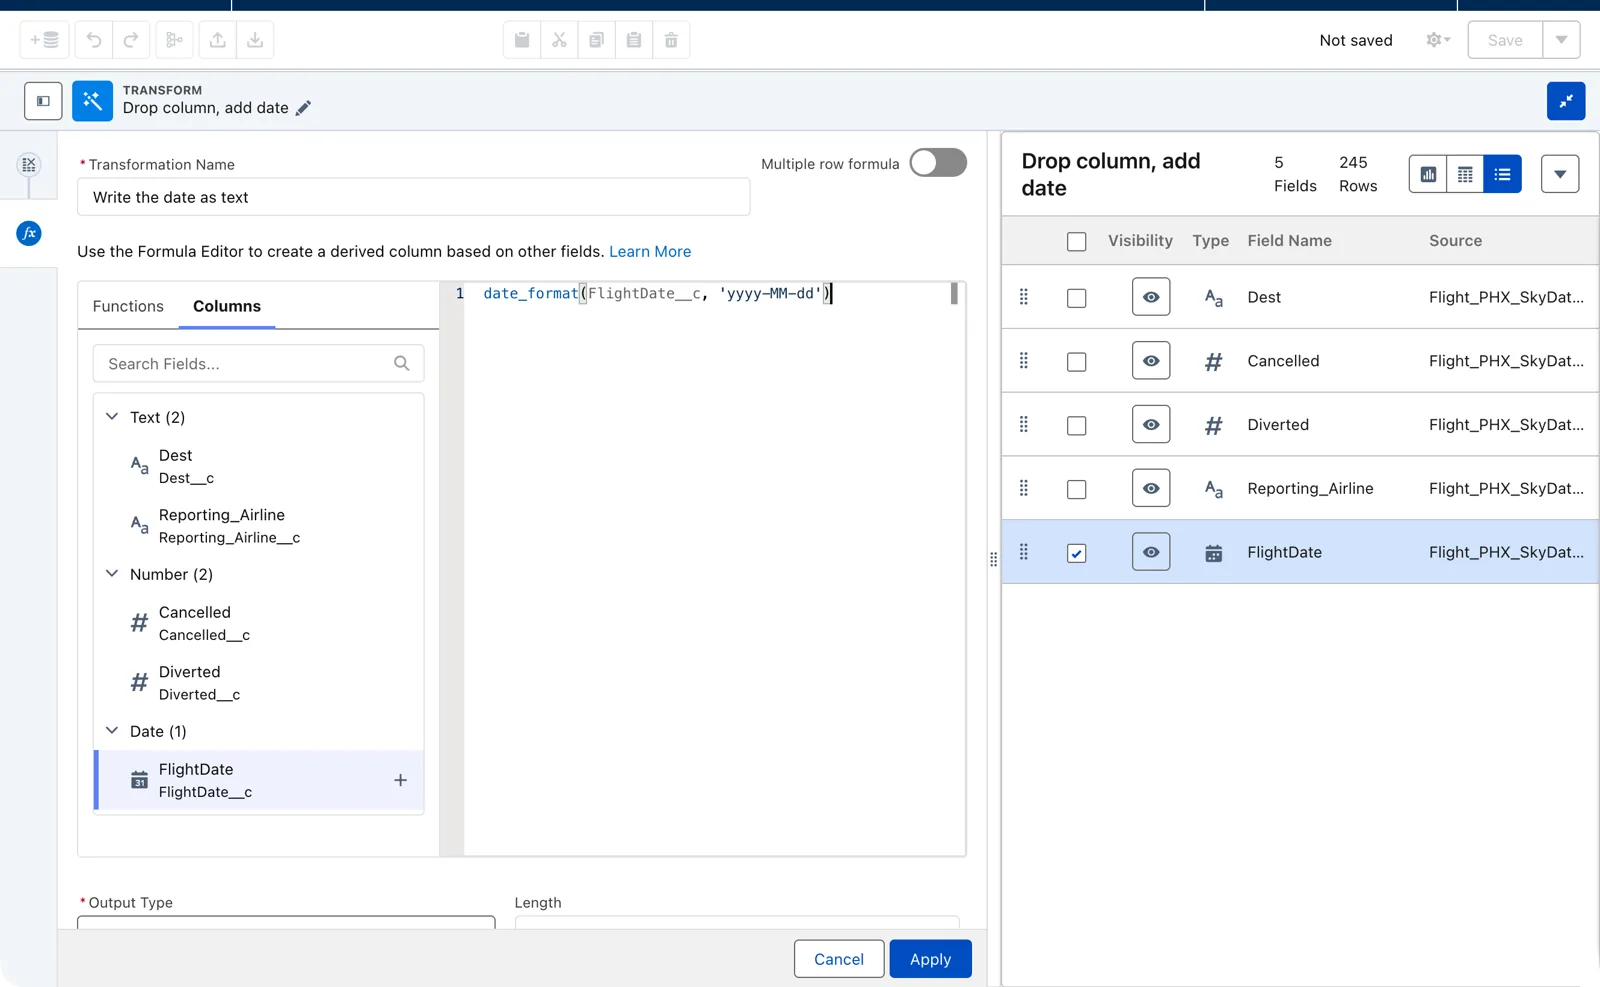
The fix: the API name, taken from the Columns tab (Salesforce Data 360 in a Developer Edition org, screenshot, November 2026). Full size
Give the node a name that says what it does, like “Drop column, add date”. It now holds two steps, and the preview shows six columns: five from the input and the new arrival date.
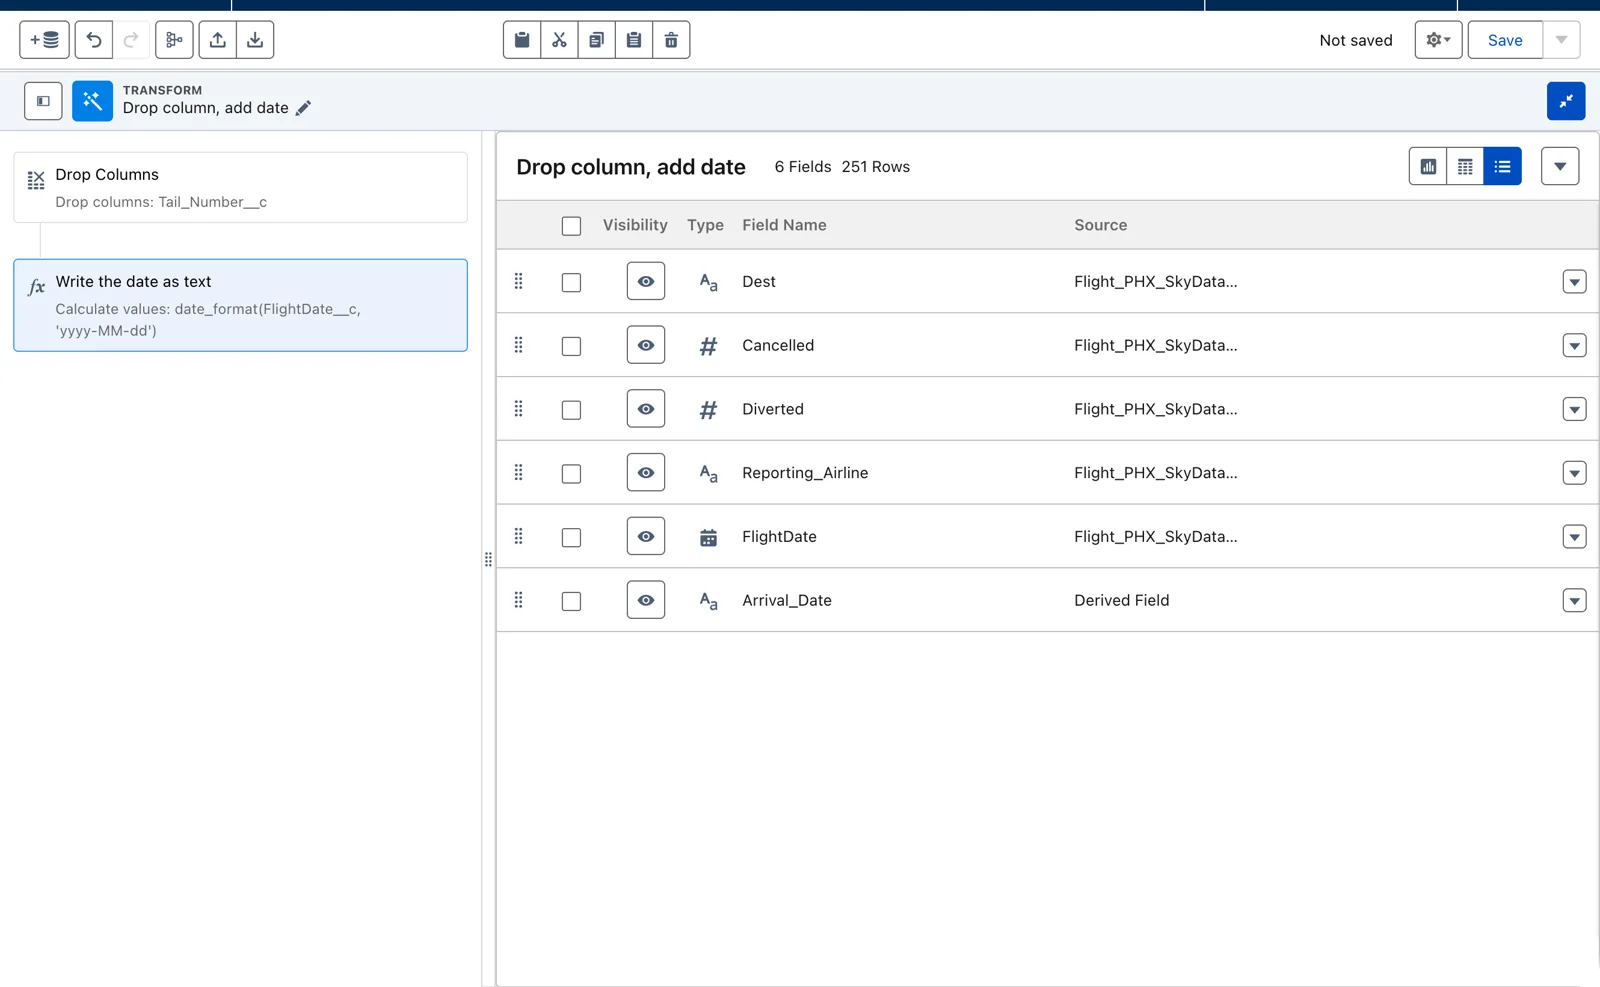
The transform node with its two steps (Salesforce Data 360 in a Developer Edition org, screenshot, November 2026). Full size
A warning before you save
Section titled “A warning before you save”Here’s something to know before you try to save your work. Until you add an output node at the end, it’s going to throw an error when you try to save. Salesforce says it plainly: “You can’t save a batch data transform without an output node.” So build all the way to the end, then save.
4. Aggregate: count by airline and day
Section titled “4. Aggregate: count by airline and day”Now add an Aggregate node. First, count the rows. The count becomes a column called Rows, a number with no decimals; its API name is COUNT_Rows__c. Then add a group by the airline’s code. Then, and here’s the power, group by the arrival date as well, and apply. Now there’s one row for each airline on each day, with the number of flights it landed at PHX. I named this node “Group of Rows”.
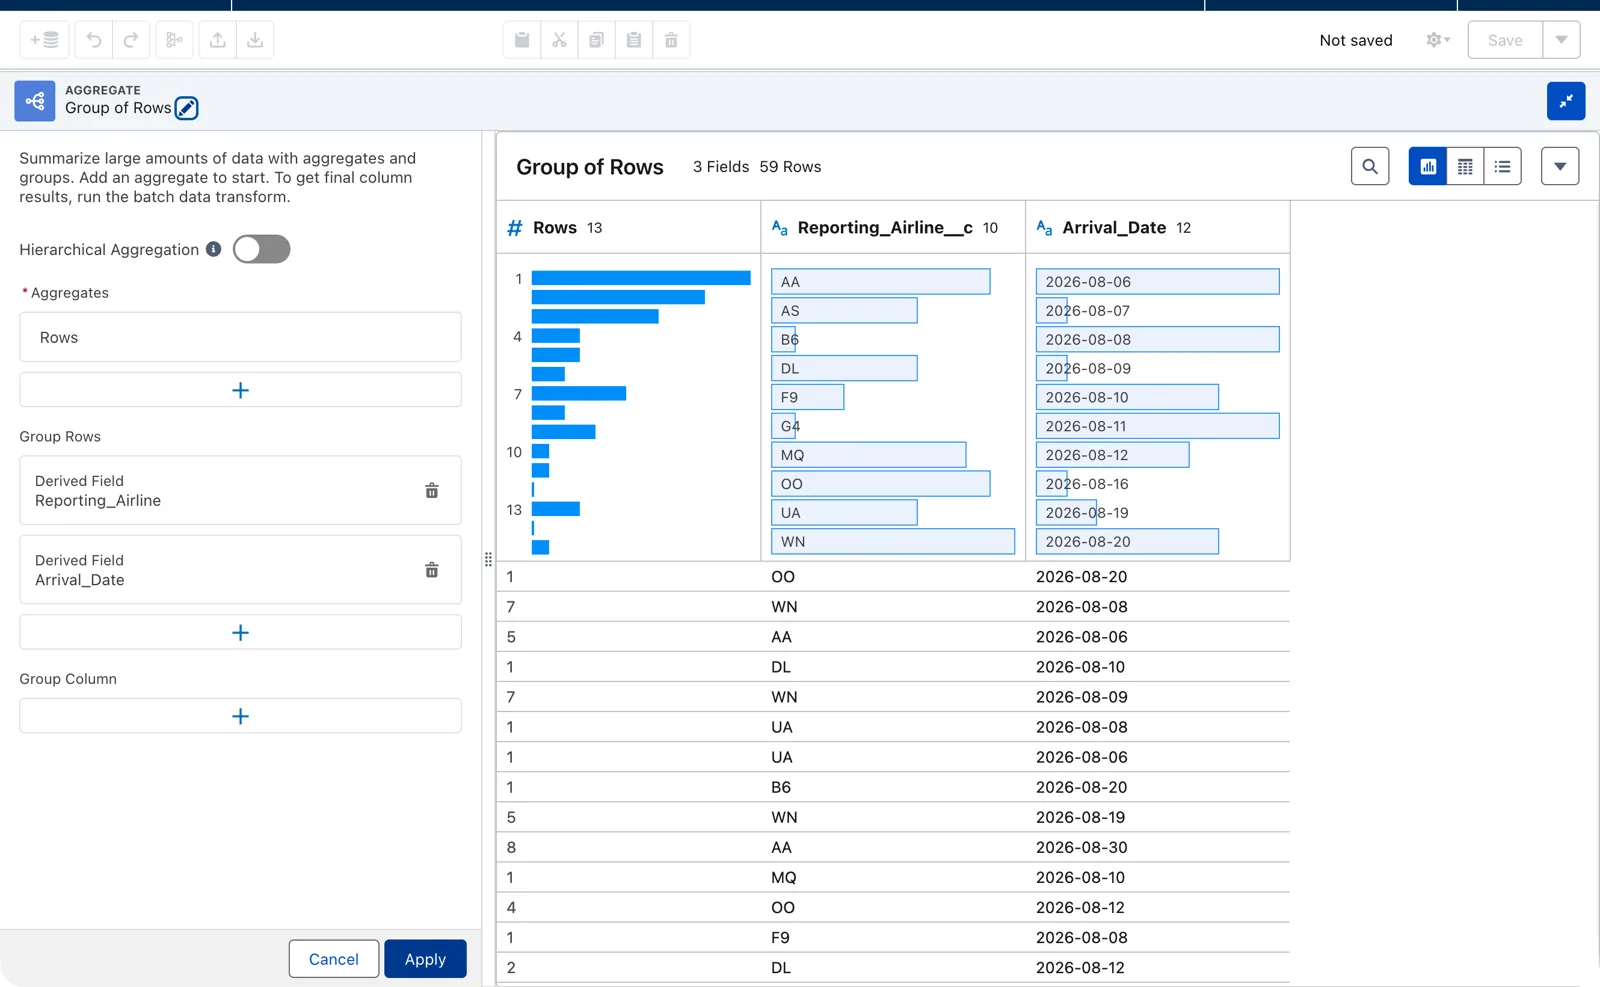
One row per airline per day (Salesforce Data 360 in a Developer Edition org, screenshot, November 2026). Full size
That’s the real beauty of the preview: you get to see the immediate result of every step. But your preview is a sample, not the whole data set, so the counts you see while building aren’t the final numbers. Where does the sample come from? Click the input node and look under Data Preview. In my org, the Sample Size was 500 rows, and the Sampling Mode was “Top 500 rows (Default)”, which “Returns the first 500 rows of your input source in its natural order.” Salesforce’s page says the default is 2,000, so check yours. You can choose 500, 1,000, 2,000 or 5,000 rows, and two other modes: Filtered rows, only rows that match filters you set, and All Column Values, which “Returns at least one of each column value”, useful when you need to see every value, for example for a bucket. In my preview, the 500 rows became 256 after the filter and 59 after the aggregate. Don’t check your numbers here; check them after the run.
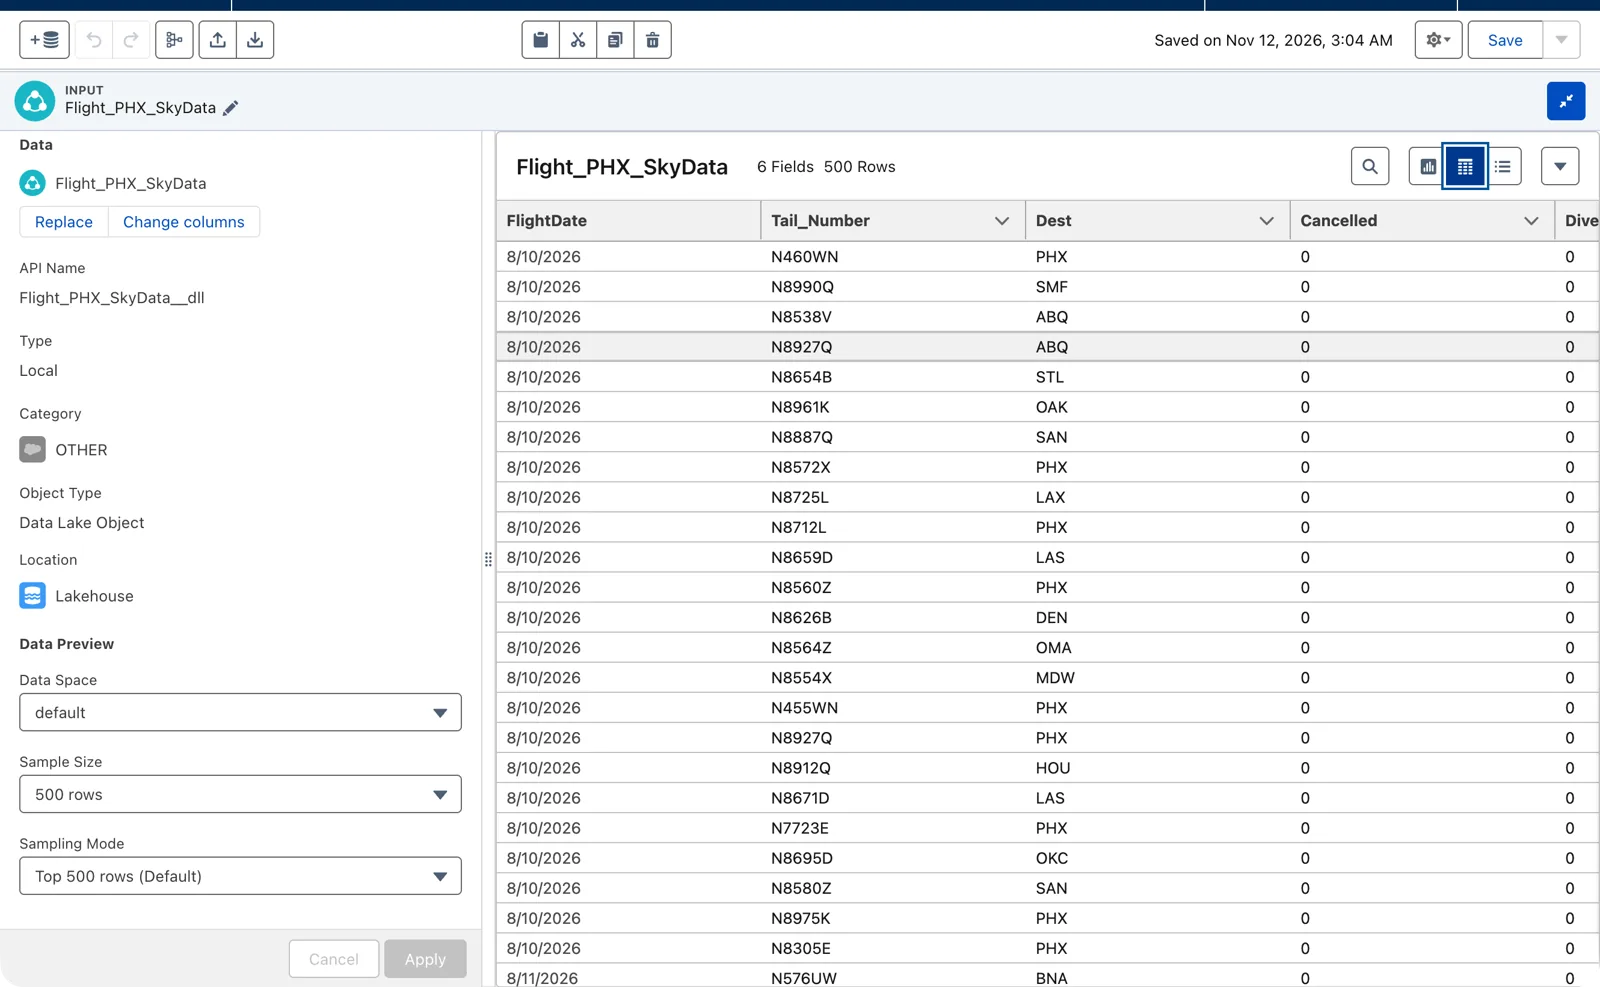
The preview’s sample, set in the input node (Salesforce Data 360 in a Developer Edition org, screenshot, November 2026). Full size
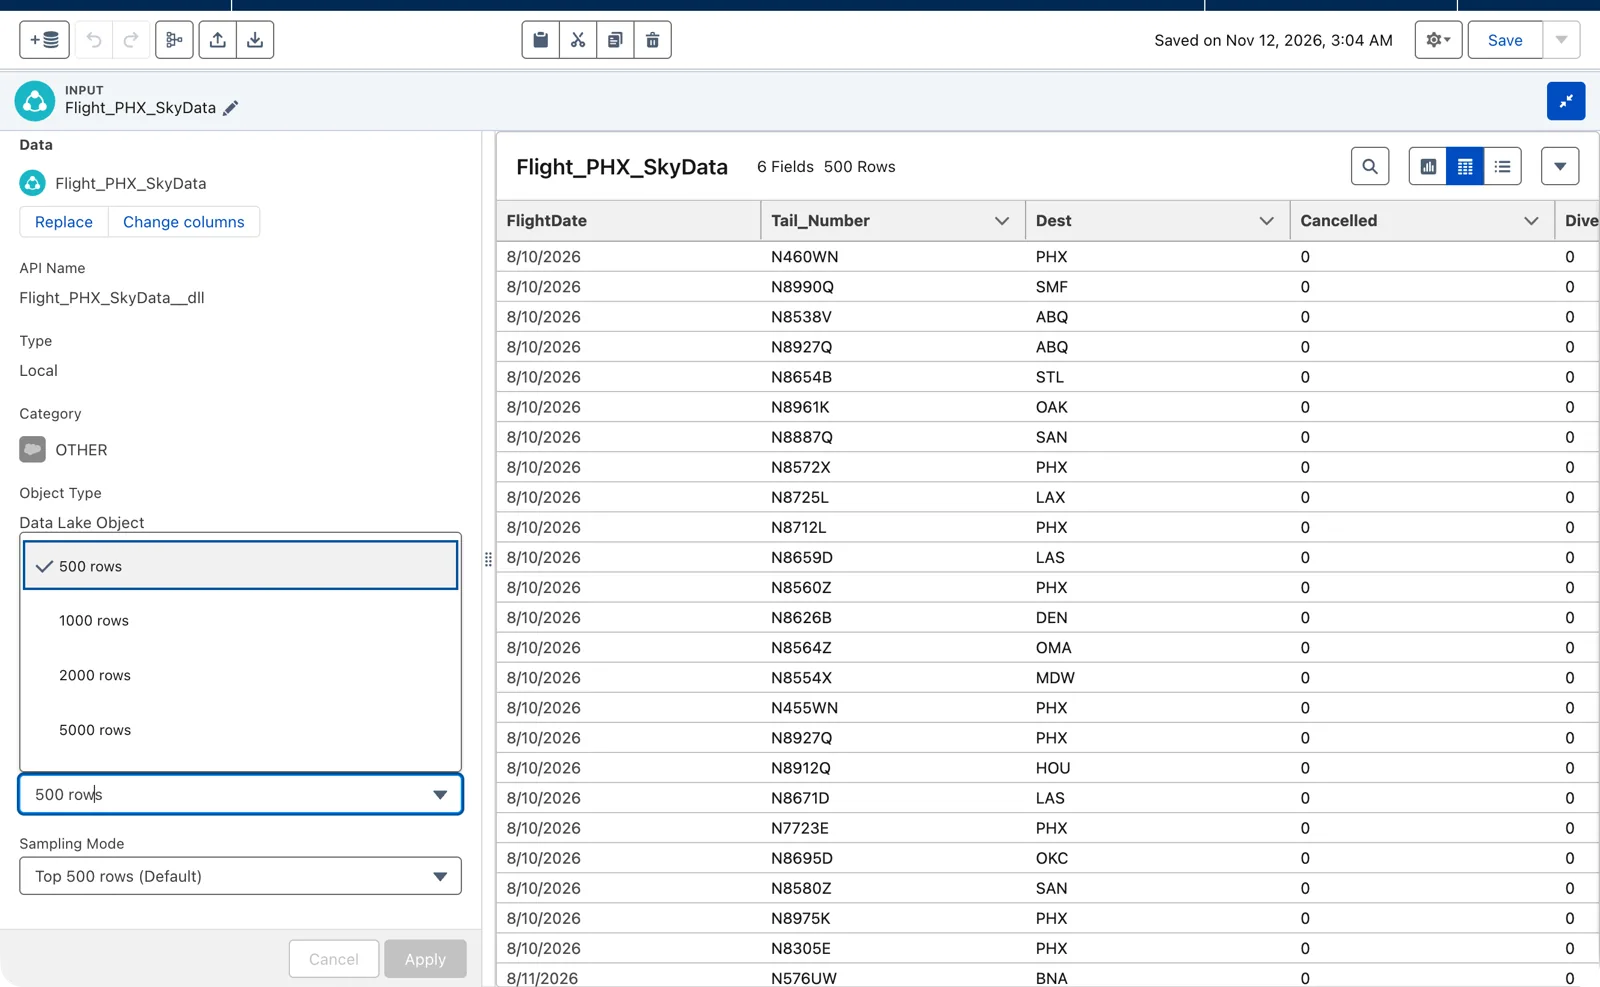
Sample Size: up to 5,000 rows (Salesforce Data 360 in a Developer Edition org, screenshot, November 2026). Full size
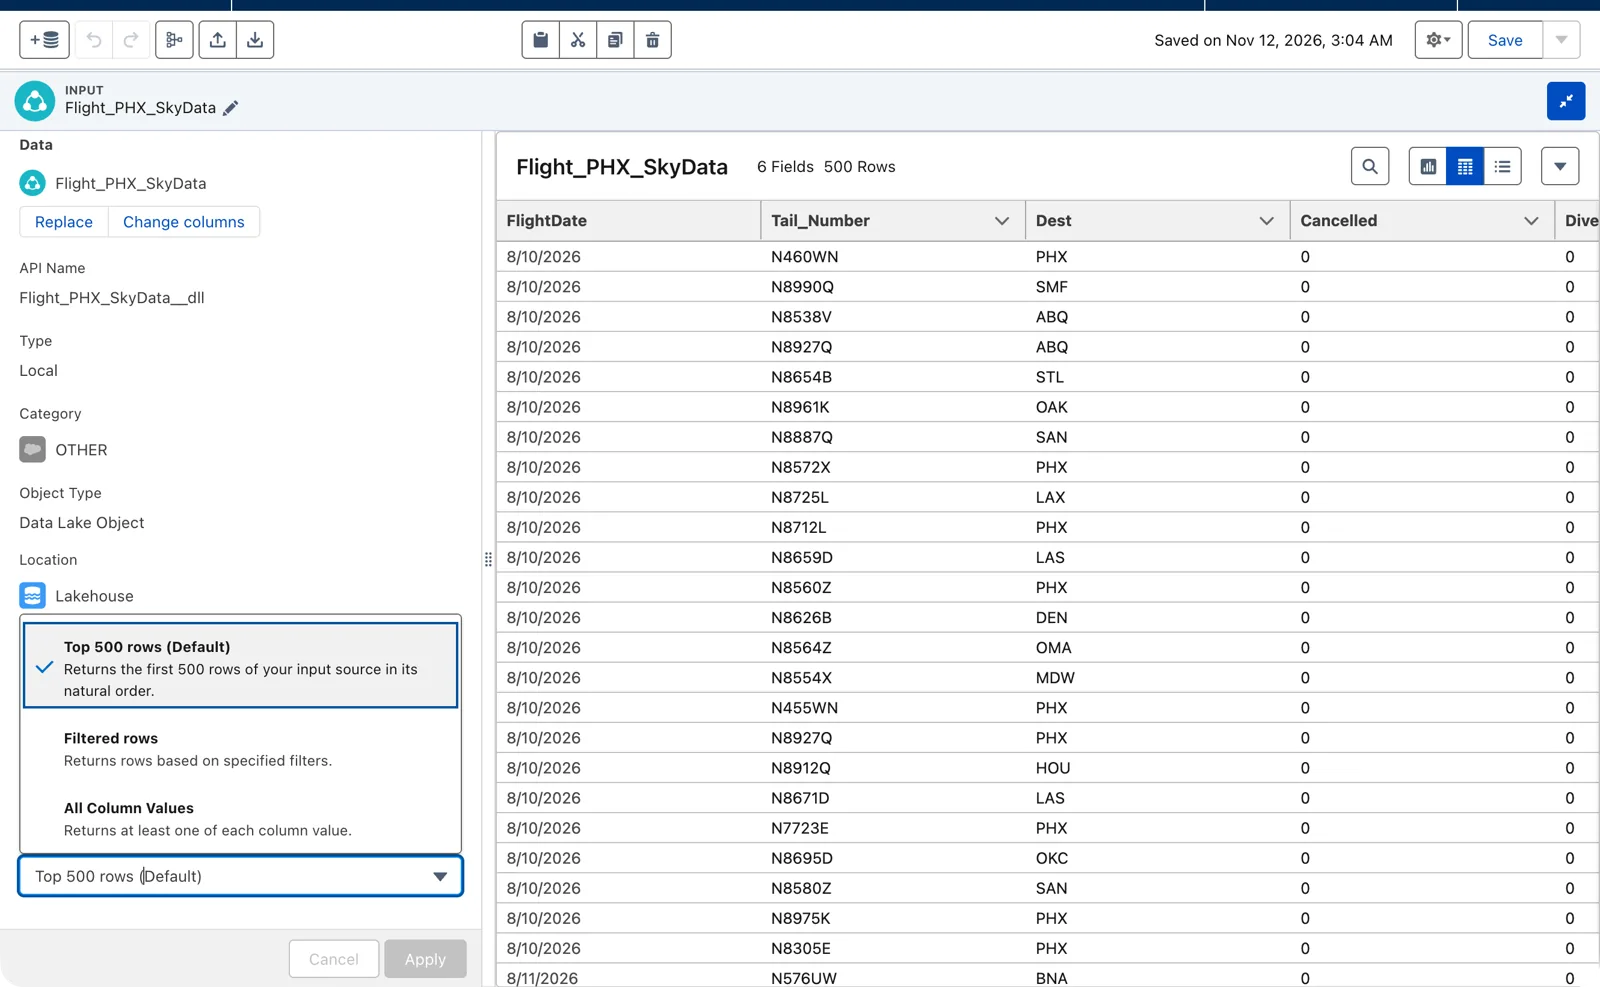
Sampling Mode: the top rows, filtered rows, or every column value (Salesforce Data 360 in a Developer Edition org, screenshot, November 2026). Full size
The aggregate node can also sum, average, count unique values, and find the maximum and minimum. It can group by any dimension or date column, and it can pivot dimensions into columns (module 6).
5. Transform: the keys
Section titled “5. Transform: the keys”Each row needs to be uniquely identified, and here each row is one airline on one day. So the key is the airline’s code and the arrival date together, for example AA_2026-08-14.
Where do you build it? Not before the aggregate. An aggregate keeps only what you counted and what you grouped by; any other column is gone after it. So add one more Transform node after the aggregate. I called it “airline date and source”. In it, add two formula columns, both Text:
airline_date, the key:concat(Reporting_Airline__c, '_', Arrival_Date)key_source, a fixed value that names where the rows came from:'PHX_ARRIVALS'
Look at the names in the first formula. The airline’s code still has its __c, because it came from the source object. Arrival_Date has none, because we made it in the transform. When in doubt, take the name from the Columns tab.
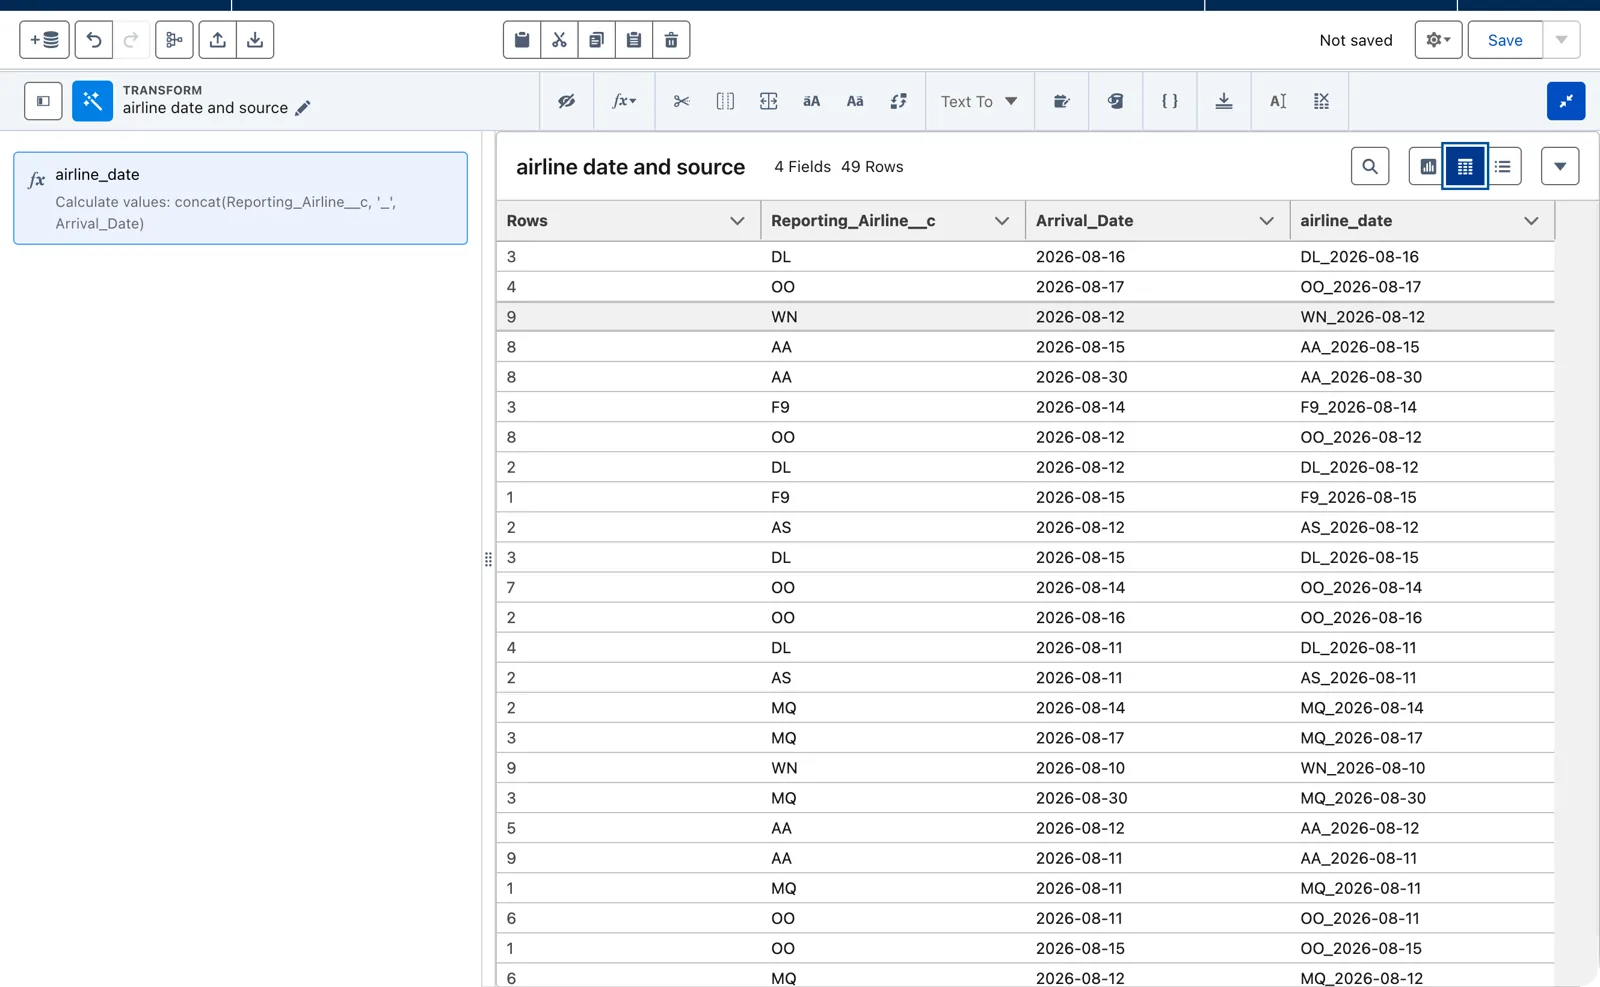
The key, built after the aggregate (Salesforce Data 360 in a Developer Edition org, screenshot, November 2026). Full size
Why the second column? If other transforms or streams ever feed this object, a column that names the source tells their rows apart. That follows Salesforce’s description: a key qualifier says where a record came from. The editor accepts a formula with no column in it, just the text in quotes. Every row gets the same value.
6. Output: a new object, with its key
Section titled “6. Output: a new object, with its key”The last node is the Output: this is where the data goes. Choose Create New. The names start as new_DLO; change them. I used the object name “PHX Arrivals by Airline and Day” and the API name PHX_Arrivals_Airline_Day. Data 360 adds __dll to the API name, and a shorter one is easier to read in lists. Salesforce warns that to write to a new object, you create it here, in the output node.
For the category, choose other. That’s not only a preference: Salesforce says input and output nodes can be data lake objects or data model objects “of type Profile or Other.” A batch transform doesn’t write to an engagement object. Leave the write mode as Replace: each run writes the month’s counts again.
Then the key. For a lake object output, the form asks for one key: the primary key. Choose airline_date. It also offers Record Modified, a date and time column that says when a row last changed; our output has none, so leave it empty. There’s no box for a fully qualified key here. Data 360 adds a key qualifier column to the new object itself, KQ_airline_date, and in my run it stayed empty. Our key_source column goes in as an ordinary column. Why key qualifiers exist, and how to build a key that really holds, is module 4.
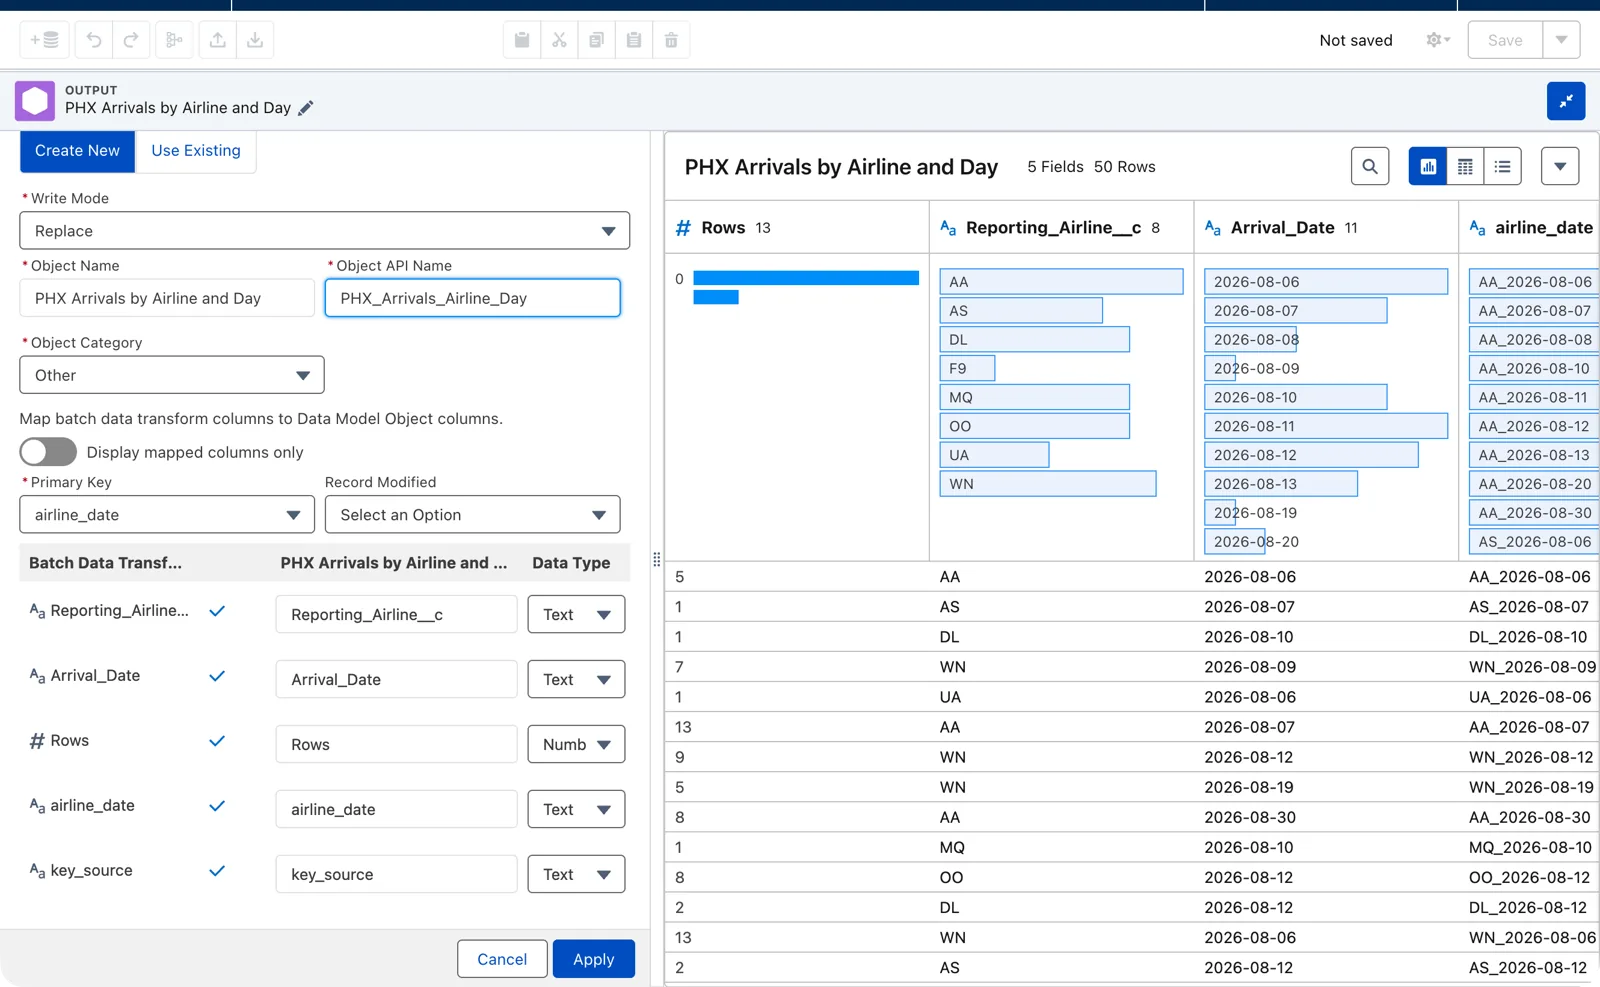
The output’s one key, the primary key (Salesforce Data 360 in a Developer Edition org, screenshot, November 2026). Full size
Below the keys, the form maps each column of the transform to a column of the new object, with its type. The five columns map by name: Reporting_Airline__c, Arrival_Date, Rows (a number), airline_date and key_source. Apply, and now you can save.
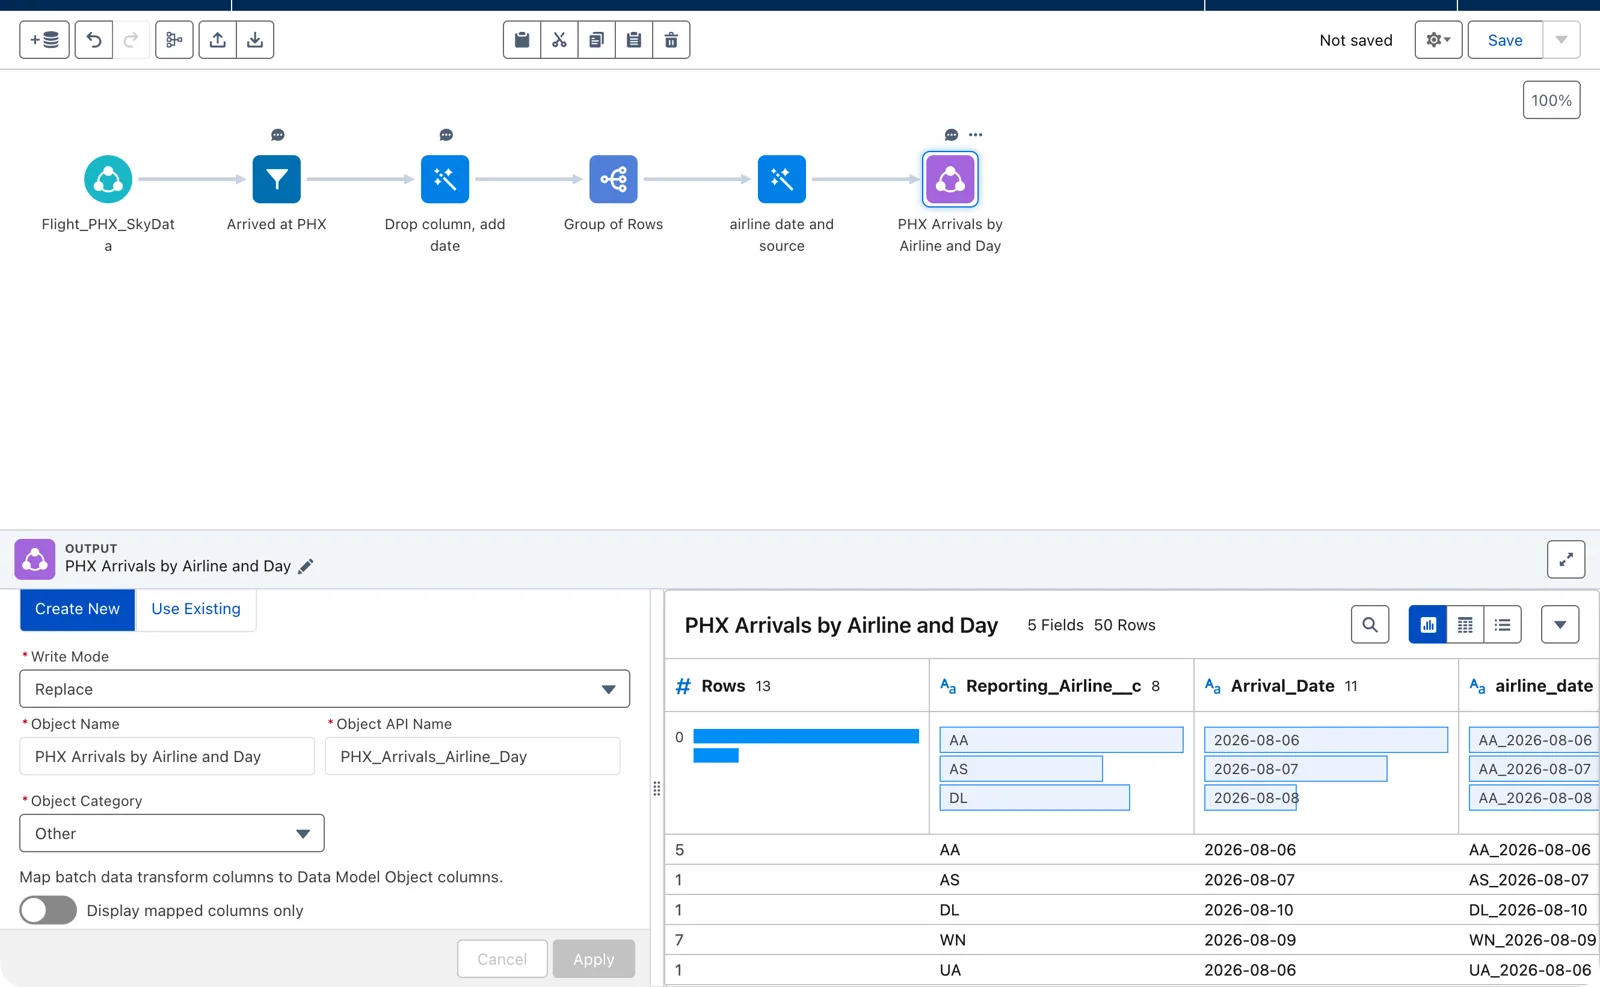
All six nodes (Salesforce Data 360 in a Developer Edition org, screenshot, November 2026). Full size
Save it
Section titled “Save it”Click Save. The dialog asks for the transform’s name, and a definition name, which it fills in for you (“PHX Arrivals by Airline and Day Definition”). Add a description, the same habit as for every object and field: what it counts, from which data, for whom. Mine reads: “Counts flights that arrived at PHX (not cancelled, not diverted) per airline per day, from SkyData bts-ontime v1.0 (August 2026, real BTS data). Output: PHX Arrivals by Airline and Day.”
Run it and check it
Section titled “Run it and check it”Saving started the first run of this transform; I didn’t have to. Don’t count on it, though: the next transform I built, in module 3’s lab, stayed at Last Run Status None after saving, until I clicked Run Now. So after you save, check the status, and if no run appears, start one. Go back to the Data Transforms tab and you’ll see it: Batch, Processing. When it’s done, the status says Success, and its refresh history shows the number of records processed. Then open the new object under Data Lake Objects. With August 2026’s flights you should have 291 rows: 10 airlines, but not every airline lands at PHX every day. My run gave 291.
Now you want to look at the rows in Data Explorer, and here’s the surprise: the new object isn’t in its list. Open the object, and it tells you why: “Data lake object not added to any data space.” A transform’s new output object starts outside every data space, and Data Explorer shows objects inside one. So add it: in Data Lake Objects, tick the object, click Add to Data Space, and choose default. The dialog warns that the data will also appear in data spaces that inherit objects from this one; that’s what we want here. Chapter 1, module 3 explains data spaces.
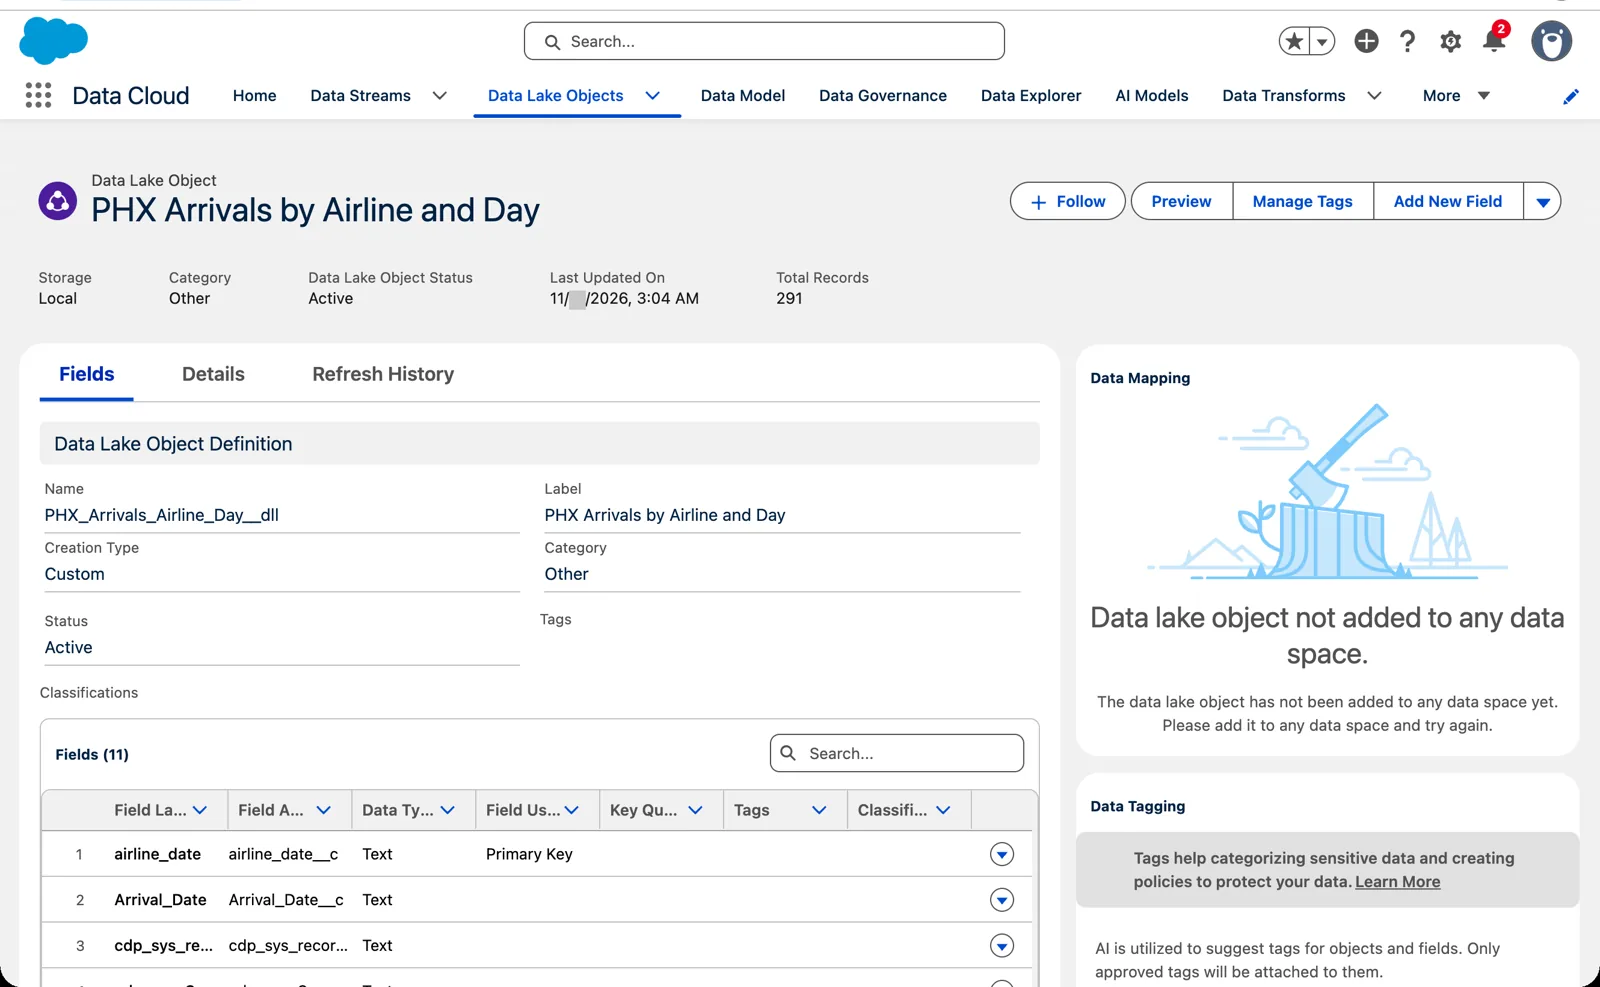
A new output object, in no data space yet (Salesforce Data 360 in a Developer Edition org, screenshot, November 2026). Full size
Now Data Explorer shows it. Choose the data space default, Data Lake Object, and the object. You’ll see airline_date, Arrival_Date, the airline’s code, key_source saying PHX_ARRIVALS on every row, the empty KQ_airline_date, and some system columns Data 360 adds, such as the data source. One column you won’t see at first is the count. Click Edit Columns and move Rows into the selected columns.
Now check it against the source. Pick one airline and one day, and count that airline’s arrivals in the raw flights yourself. The numbers should match. If they don’t, look at the filter first.
For example: in the raw flights, count the flights with Reporting_Airline AA, FlightDate 2026-08-14, Dest PHX, not cancelled and not diverted. There are 125. In Data Explorer, filter airline_date equals AA_2026-08-14: one row, and Rows says 125. In my run, it did.
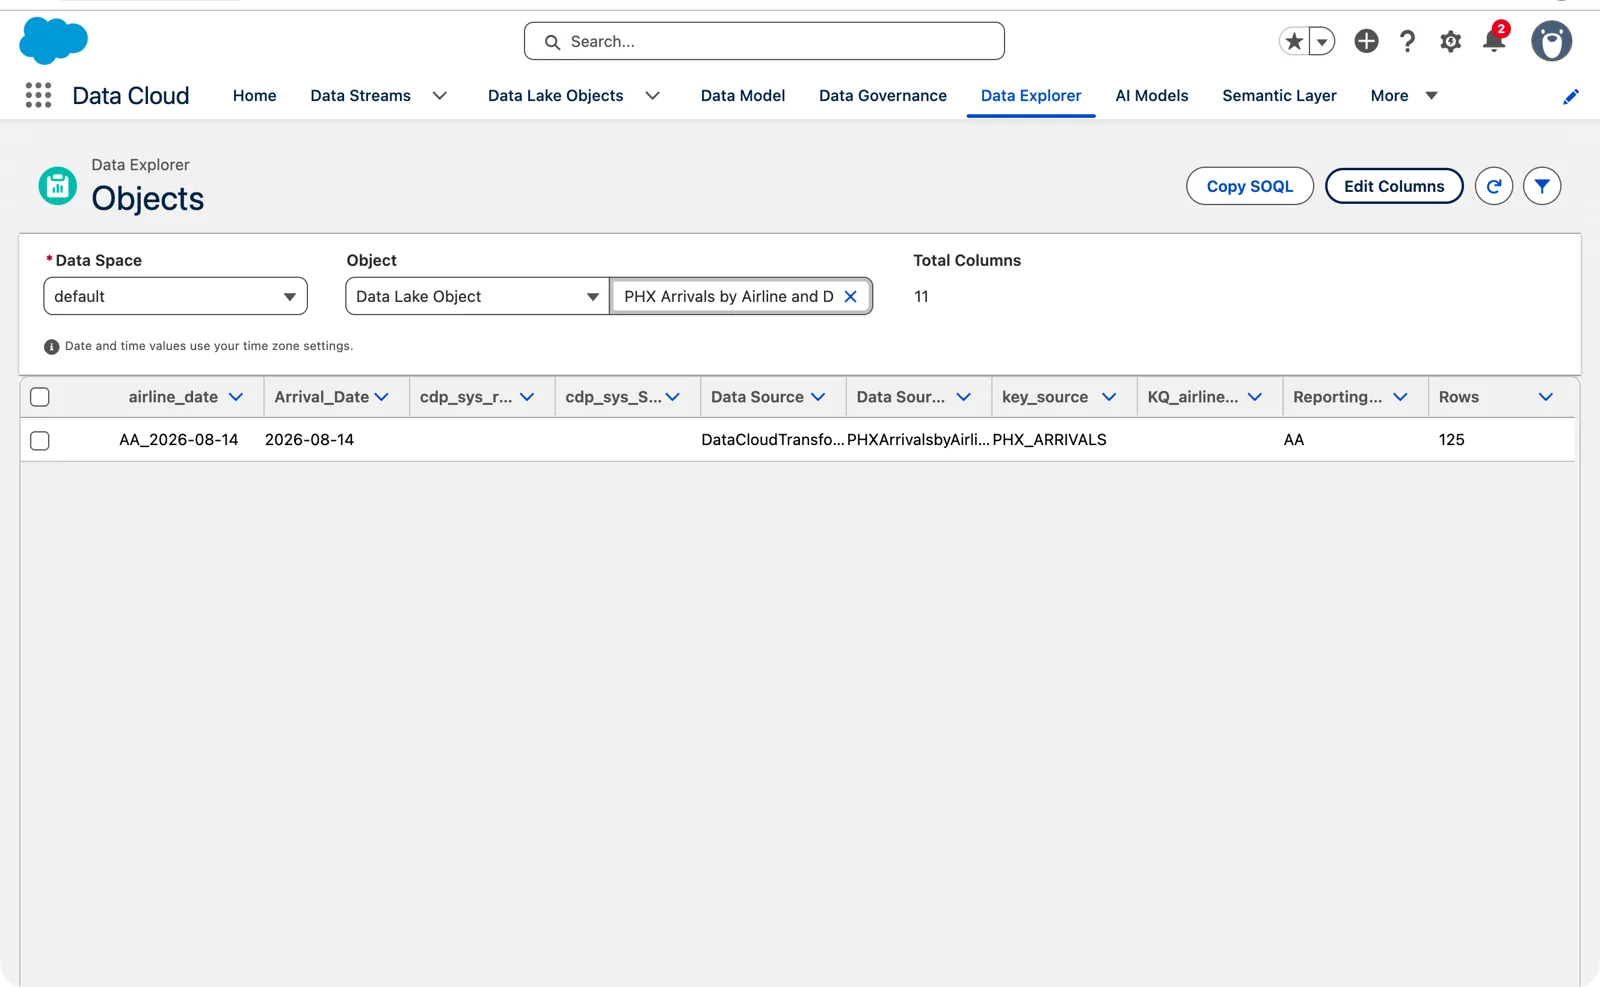
The check: 125 (Salesforce Data 360 in a Developer Edition org, screenshot, November 2026). Full size
So very simply: take a set of data, filter it, remove columns, aggregate and group it, add the necessary keys, and target a new object, which you can look at and use in your calculations.
A note on what these numbers are. They’re counts of flights, as the airlines reported them to BTS. They say how many flights each airline landed at PHX each day. They don’t say which airline is better. That’s true of every number from this data in the course: we show what it says, and we don’t judge an airline by it.
After that first run, you run it again to bring in the latest data, by hand with Run Now from the transform’s menu, or on a schedule. A run is incremental, only what’s changed, or full, everything. Salesforce decides which: “You can’t configure the run type. The batch data transform selects the run type based on specific criteria.” An incremental run needs, among other things, a scheduled transform, and changes to less than 5% of the input. It also supports only some transformations, and the aggregate isn’t on Salesforce’s list, so a transform like ours runs in full.
What you can do is ask for a full run. In my org, Run Now said it “will attempt to run in incremental mode when possible,” with a checkbox, Run with all data, already ticked. That checkbox isn’t on Salesforce’s run pages yet (re-read November 2026). So you can always ask for everything; you can’t make a run incremental. Module 6 looks at incremental runs.
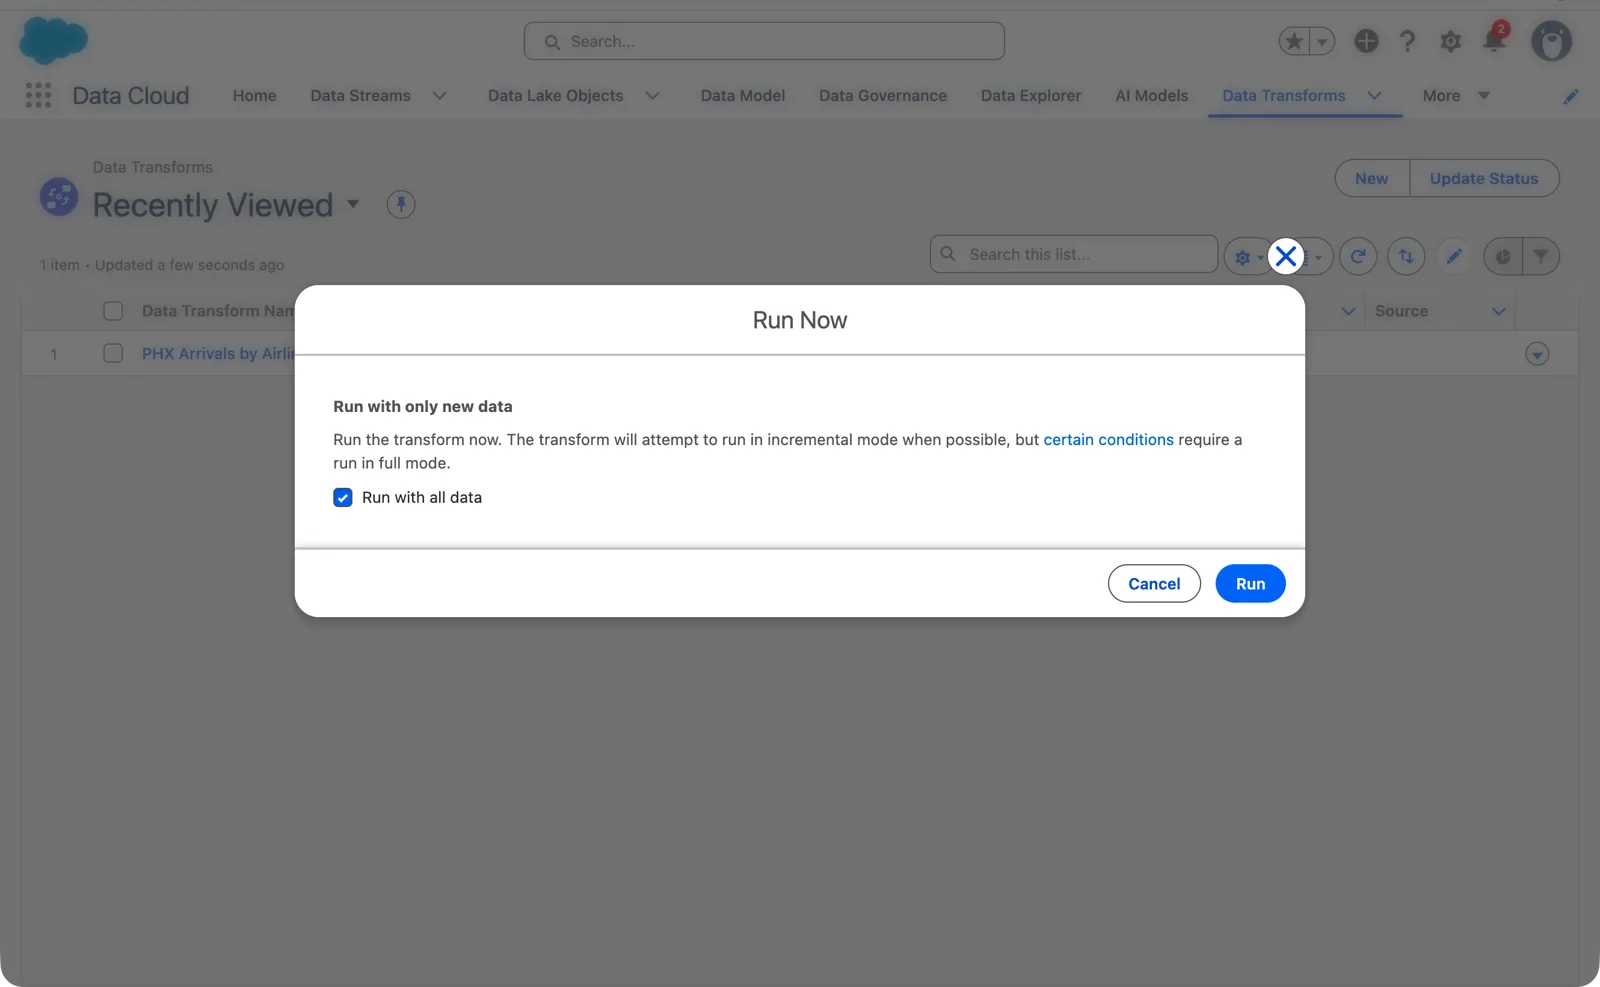
Run Now (Salesforce Data 360 in a Developer Edition org, screenshot, November 2026). Full size
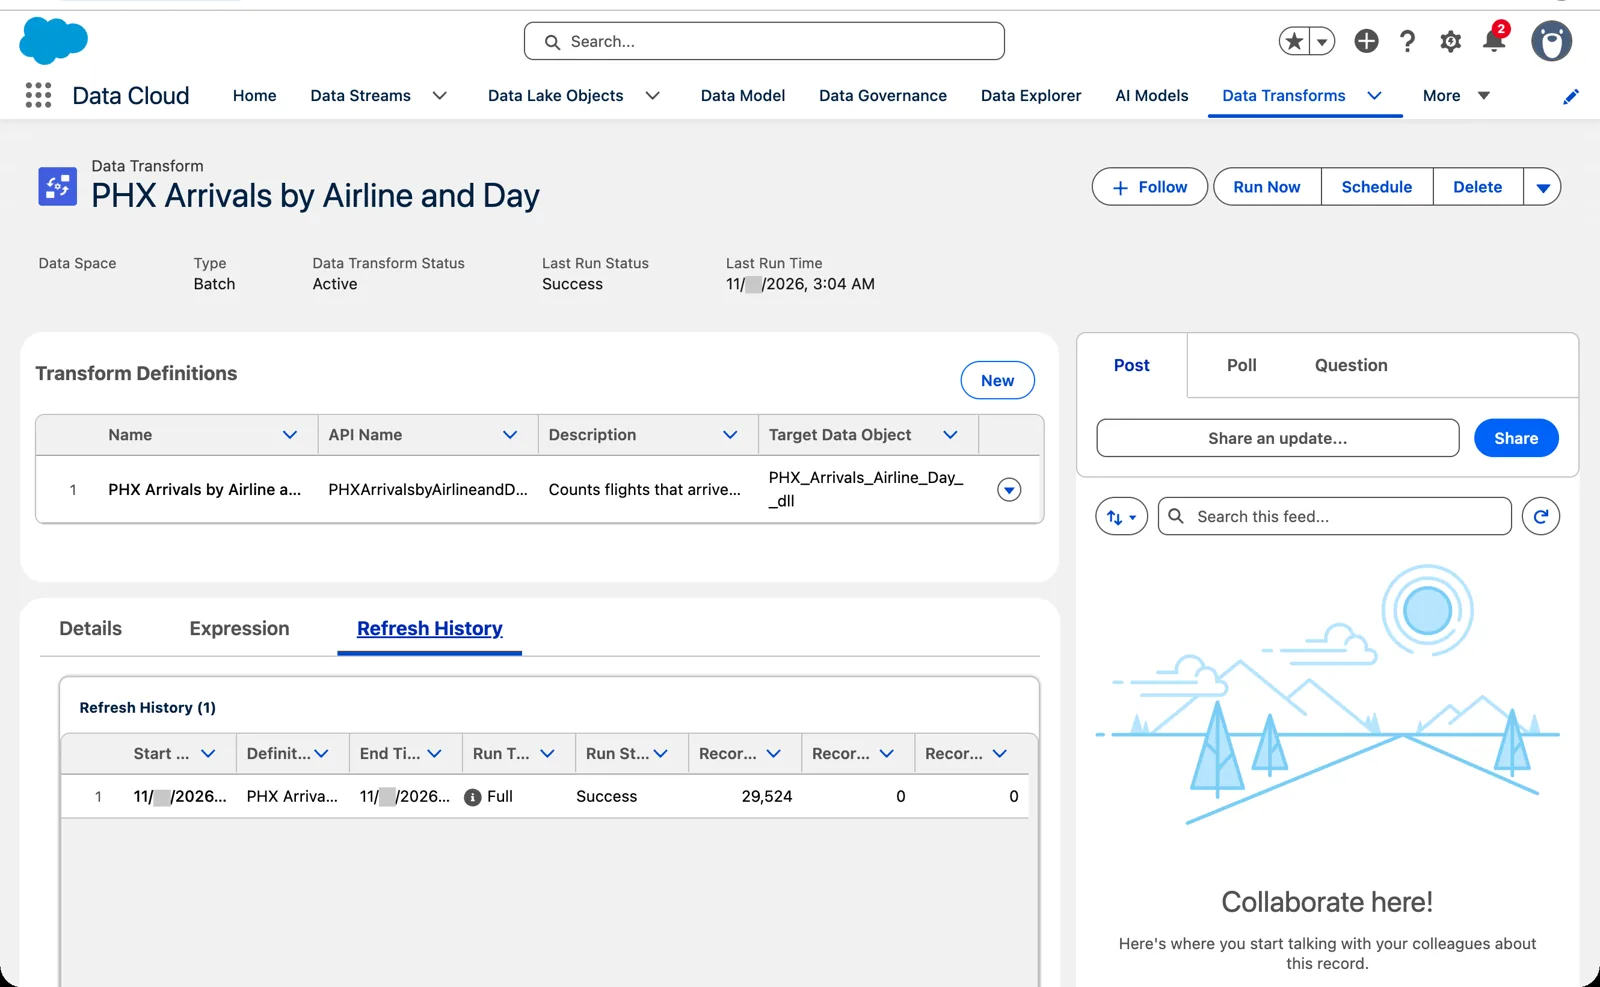
The first run in Refresh History: a full run (Salesforce Data 360 in a Developer Edition org, screenshot, November 2026). Full size
The rules to know
Section titled “The rules to know”From Salesforce’s pages:
- Lake in, lake out; model in, model out. “You can’t have a data lake object input node and a data model object output node, and vice versa.”
- Different objects. “You can’t use the same data object for both input and output nodes.”
- One transform per target. “You can’t write multiple transforms to the same object.” To bring several sources into one object, bring them into one transform, for example with an Append node, which combines rows.
- Your output is an input. A transform’s output can feed another batch transform, and downstream processes such as identity resolution, calculated insights and segmentation.
And from my own run:
- A new output object is in no data space until you add it. Until then, Data Explorer can’t show it.
- Formulas use API names, such as
FlightDate__c, not the labels on the screen. - Build keys after the aggregate, because an aggregate keeps only its groups and its counts.
Watch a sample on video
Section titled “Watch a sample on video”In 2024 I built this same kind of transform in my demo org, on airport traffic: arrivals filtered, reshaped and counted by airline by day, node by node, on data model objects. The nodes are the same as above; the data and the filter are different. The note under the video says what’s still right and what’s changed since.
What an architect decides here
Section titled “What an architect decides here”- The question the output answers, and so the grain: one row per what? Here, one airline on one day.
- What the words in the question mean in the data: here, “arrived” is a destination, not cancelled, and not diverted.
- Where the transform reads from: lake objects (raw, before the model) or model objects (inside a data space).
- The names of the nodes and the output object, so the next person can read the transform.
- The output’s category (profile or other) and its keys (module 4).
- Which data space the output joins, so the people and processes that need it can see it.
Explore
Section titled “Explore”All checked 2026-11-14, except where dated.
- Create a Batch Data Transform (opens in a new tab), Salesforce Help.
- Input and Output Nodes: Add Data and Write to a Batch Data Transform (opens in a new tab), Salesforce Help.
- Aggregate Node (opens in a new tab), Salesforce Help.
- Batch Data Transforms Limitations (opens in a new tab), Salesforce Help.
- Data Preview Sampling (opens in a new tab), Salesforce Help (checked 2026-11-14).
- Batch Data Transform Run Types (opens in a new tab), Salesforce Help (checked 2026-11-14).
- TranStats (opens in a new tab), US Bureau of Transportation Statistics: the source of the flight data (checked 2026-11-14). Credit: “Source: US Bureau of Transportation Statistics (TranStats).”
- SkyData: Data Transforms (opens in a new tab), this chapter’s data files.
- SkyData: BTS on-time v1.0 (opens in a new tab), the data card: source, license and fields.